

Summary of key points: -
- Record trade surplus in March confirms the export stimulus to the NZ economy
- The markets dictate the judgement on Trump’s first 100 days
- How far can the US dollar fall?
- Political risk and interest rate decisions added to the Aussie dollar mix
Record trade surplus in March confirms the export stimulus to the NZ economy
It was not so many years ago that the local financial and investment markets rated the monthly import and export merchandise trade numbers as one of the more important indicators for the direction of the economy. The performance of exports and imports was viewed as a key barometer for the economy, alongside GDP and CPI Inflation statistics.
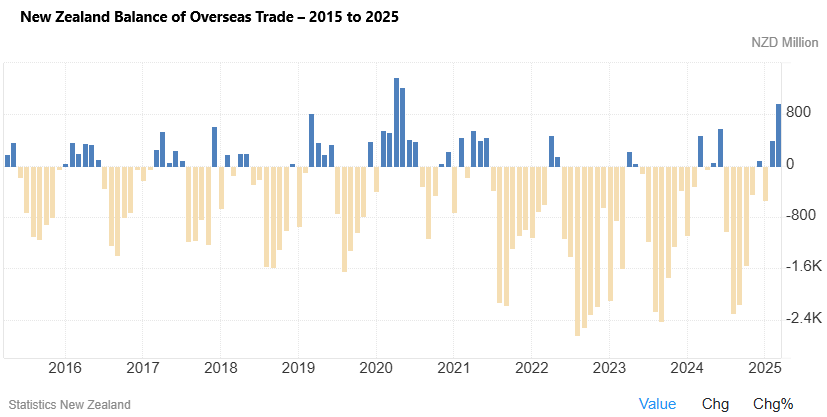
Last Tuesday, for the month of March, New Zealand recorded its highest value of exports ever for one month. New Zealand exported $7.59 billion over the month; however, the significance of that fantastic result seemed to be almost totally ignored by the local mainstream financial and business media. Exports for March 2025 were 19% higher than March 2024. The trade surplus of exports ($7.59 billion) greater than imports ($6.60 billion) amounted to $970 million. The surplus was the largest since the Covid-affected months of April and May 2020. Outside of those Covid disrupted months, the surplus for the month of $970 million was the largest since April 2011. These are stunning numbers for the New Zealand economy, and if the strong upward trend continues in this vein, the positive stimulus to overall economic growth should not be underestimated. The impressive export figures are a happy combination of higher export prices, strong offshore demand, the weaker Kiwi dollar, favourable climatic conditions and increased primary production. A perfect storm of positive forces.
Our exporters are certainly making hay whilst the sun is shining, as there are potential risks ahead with Chinese and US demand for our exports being impacted by all the global trade war uncertainty.
Compared to March 2024, the component parts of our hot export performance were:-
- Milk powder, butter and cheese: $596 million higher, +35%
- Meat: $286 million higher, +34%
- Fruit: $271 million higher, +74%
- Mechanical machinery and equipment: $93 million higher, +50%
Twelve months ago, our annual trade deficit was $10.0 billion, that has now almost halved to $6.1 billion in March 2025. Over the last 12 months annual goods exports were $74.1 billion, up a whopping $5.1 billion from the previous year. That is a lot of additional dollars coming into the New Zealand regional economy. A recent regional economic survey had Canterbury, Otago and Southland as be far the most positive.
Subdued domestic spending over the coming winter months should see imports continue to plateau, whilst exports power on. Strong imports of consumer goods in the 2022 and 2023 period, fuelled by the extraordinary monetary and fiscal stimulus at the time, caused larger monthly trade deficits through that period (refer to light brown bars in the chart below). Whilst primary produce exports are slower in the winter months, we still should see a continuation of monthly trade surpluses over coming months, further reducing the rolling annual trade deficit amount.
Export industries are driving an economic recovery and the overseas merchandise trade data is clear evidence of the quantum of that contribution and change. Running trade surpluses is no guarantee that your currency will appreciate in value, however it is certainly not a negative for the Kiwi dollar.
The markets dictate the judgement on Trump’s first 100 days
The actions and consequential impact of decisions taken by any new political leader in their first 100 days of power is a measurement used not only on newly elected US Presidents but also applied around the world. On any measurement you care to choose, the first 100 days of the second Donald Trump Presidency has been an unmitigated disaster. The financial and investment markets have provided clear-cut judgements every day in their pricing and trends. So far, it is all downwards!
Over the last 100 days we witnessed extraordinary volatility and uncertainty in bond, equity and currency markets. The net result being that share values have fallen, the US dollar has depreciated by 10% on capital flight and the bond market vigilantes have forced Trump to U-Turn. The chaos and disruption caused by Trump’s misguided tariff and trade policies is already showing up in softer US economic data and we will see that continue over coming weeks. The specter of empty shelves in US supermarkets and department stores as a result of the tariff policies, may have to be the pictorial reality check that Trump needs to announce more concessions on his ridiculous tariff stance.
The US dollar is on-track for its worst performance during the first 100 days of any US President since Richard Nixon was in the White House in the 1970’s. Hardly a vote of confidence in what Trump is doing. Tumbling shipping volumes into US West Coast ports, sharply declining foreign tourism into the USA and shrinking credit card payments in consumer sectors are all early signs of emerging negativity in US economic data. Equity, bond and currency markets stabilised somewhat over the last week as Trump U-Turned on tariffs with China and also U-Turned firing Federal Reserve Chairman Jerome Powell. Equity, bond and currency markets have seemingly already become tired and wary of what the enigmatic and erratic Trump will say and do next. Therefore, volatility in the markets is now decreasing as traders and investors lower their bets/positions until some clarity emerges. That clarity will be in the form of softer US economic data, which would be expected to ignite a second wave of decreasing equity markets, depreciation in the US dollar and lower bond yields.
Latest indications are that Trump and Ukrainian leader Volodymyr Zelenskyy are talking again (at the Pope’s funeral) to find a way to end the war, however (predictably!) Vladimir Putin has played Trump along and Trump is finally realising what everyone else could see in this respect. A ceasefire in the Ukrainian/Russian war as a fore-runner to a peace deal would still be negative for the US dollar and positive for the Euro currency value.
How far can the US dollar fall?
In sending the US dollar value lower (after the initial euphoric USD increase on being elected), Trump, in this current term as President, is out-performing what he achieved in Trump 1.0 in 2017! The US dollar (refer to the chart below) has depreciated 10% within three months of being elected, that took more than six months in hist first term.
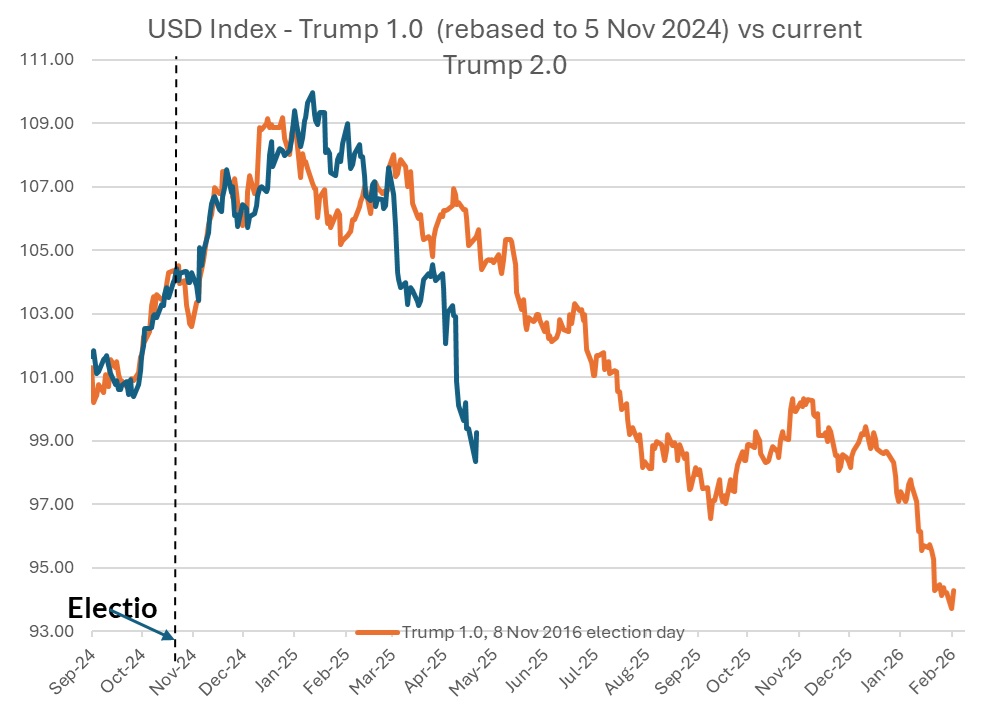
Looking ahead, the question is whether we will continue to see a straight line downwards in the US dollar’s value, or is there some event or development that will cause a correction back upwards? Softer than expected US economic data over coming week/months suggests a continuation of the plunge in the USD value, for two reasons: -
- Interest rate markets will price more Fed cuts, as it becomes evident that a sharply weaker labour market (rising unemployment rate) outweighs the risk that the tariffs will permanently lift inflation.
- Disinvestment and capital flight out of the US continues as fund managers around the globe re-weight their investment portfolios to lower USD denominated allocations. These investment asset class re-allocation processes take time, and we have only witnessed the start of that expected seismic shift in investment funds exiting the US.
A total Trump capitulation on tariffs with China and everyone else, would see the US dollar rebound, as it reverses its direction to the introduction of those tariffs. The probability of that occurring does not appear to be high at this point. Trump claims to be talking to Premier Xi Jinping, however there is no confirmation of that actually happening from the Chinese side.
Upcoming US economic data that is likely to prompt new and additional US dollar selling includes:-
- GDP growth data for the March quarter on Wednesday 30th April: After expanding at an annualised GDP growth rate of 2.40% in the December 2024 quarter, prior consensus forecasts are for a significant reduction to a +0.40% annual rate. A result below that will USD negative.
- Non-Farm Payrolls jobs data for April on Friday 2nd May: Following the surprisingly stronger than expected 228,000 increase in jobs in the month of March, the April forecasts are for a much lower increase of 130,000 to 140,000. Again, a weaker outcome below forecast, will see USD selling on the expectation of earlier Fed cuts to interest rates.
Should the GDP and jobs data print softer than forecast, the USD depreciation to below the previous low of 97.80 on 21 April, would send the NZD/USD exchange rate above 0.6000.
Longer term, we have been of the view for some time that the US Dollar Dixy Index will return to trading in the 90.00 to 100.00 range, averaging around 95.00. The US dollar traded in this range from 2016 to 2020 when US inflation and US interest rates were at levels that were not elevated compared to other economies. A further 4.00% depreciation in the USD to 95.00 would push the NZD/USD exchange rate to near 0.6500. Local USD exporters who are not hedged against such a further deterioration in the USD’s value should still be acting at the current spot rate of 0.5965.
Political risk and interest rate decisions added to the Aussie dollar mix
If the current political opinion polls in Australia are wildly inaccurate and the Opposition Coalition pull off a stunning “come from behind” victory in this Saturday’s general election, the Australian dollar would most likely gain some traction higher. Outside of that unlikely result, the status-quo of the Albanese Labour Government being re-elected would see a continuation of movements in the AUD/USD exchange rate being determined by the USD side of the currency pair, not local developments.
When the outlandish Trump tariffs were announced on “Liberation Day” 2nd April, the AUD/USD rate initially plummeted to 0.5900 as the Aussie interest rate markets immediately shifted to pricing-in large and immediate interest rate cuts by the Reserve Bank of Australia (“RBA”) from their current 4.10% level. That pricing included a bumper double cut of 0.50% at the upcoming 20th May meeting of the RBA. The probability of a 0.50% cut has been wound back over this last week as the chances of a really bad global trade war appears to be reducing with Trump already reversing his hard-ball stance and relenting to concessions. Pricing of a 0.50% cut has dropped to a 10% chance, compared to a 40% probability just seven days ago.
The RBA will now go with a 0.25% reduction to their OCR on 20 May to 3.85%, however the market focus will be on the overall tone of their statement. Nothing has really changed in the Australian domestic economy over recent months in respect to the problem the RBA has with sticky inflation due to constant wage increases without productivity improvement. A repeat of that cautious tone from the RBA would be more hawkish (or less dovish) than what the markets are expecting.
What determines the RBA’s tone and outlook will be the crucial March quarter’s inflation data on Wednesday 30th April. Prior consensus forecasts are for inflation to increase by 0.70% to 0.80% for the quarter, reducing the annual rate of inflation from 2.40% to 2.20%. The RBA prefer the “trimmed-mean” measure of inflation which removes the volatile, outlying increasing and decreasing components. The trimmed-mean CPI annual rate remains high at 3.20% and should decrease to 2.80% if the March quarter inflation forecasts prove accurate. Whether that return to the targeted 2.00% to 3.00% band is sufficient for the RBA to turn dovish on the future outlook remains to be see. We doubt it!
The Australian wages index on 14th May and employment figures on 15th May for April will also be important data points for the RBA. The unemployment rate remaining low at the current 4.10% level would be no reason for the RBA to suddenly turn dovish on the economy and therefore their monetary policy settings. The RBA have a dual mandate on inflation and employment (the same as the Fed in the US) and a continuing strong labour market and wage increases above 3.00% means that the RBA has no reason to assist the economy with lower interest rates.
As previously stated, outside of the general election and RBA interest rate decisions, the potentially most positive development for the Australian dollar is the Americans and Chinese reaching a compromise deal on tariffs. Trump may desperately want a ”deal” with the Chinese to prove to his backers he can make a change. However, on the Chinese side, they feel under no pressure or hurry to compromise with the man who started this trade mess. The Chinese will be taking longer-term view that like all dictators before him (Julious Ceasar, Napoleon Bonaparte and Adolf Hitler), President Donald Trump will ultimately fall from power due to his own arrogance, over-reach and over-confidence!
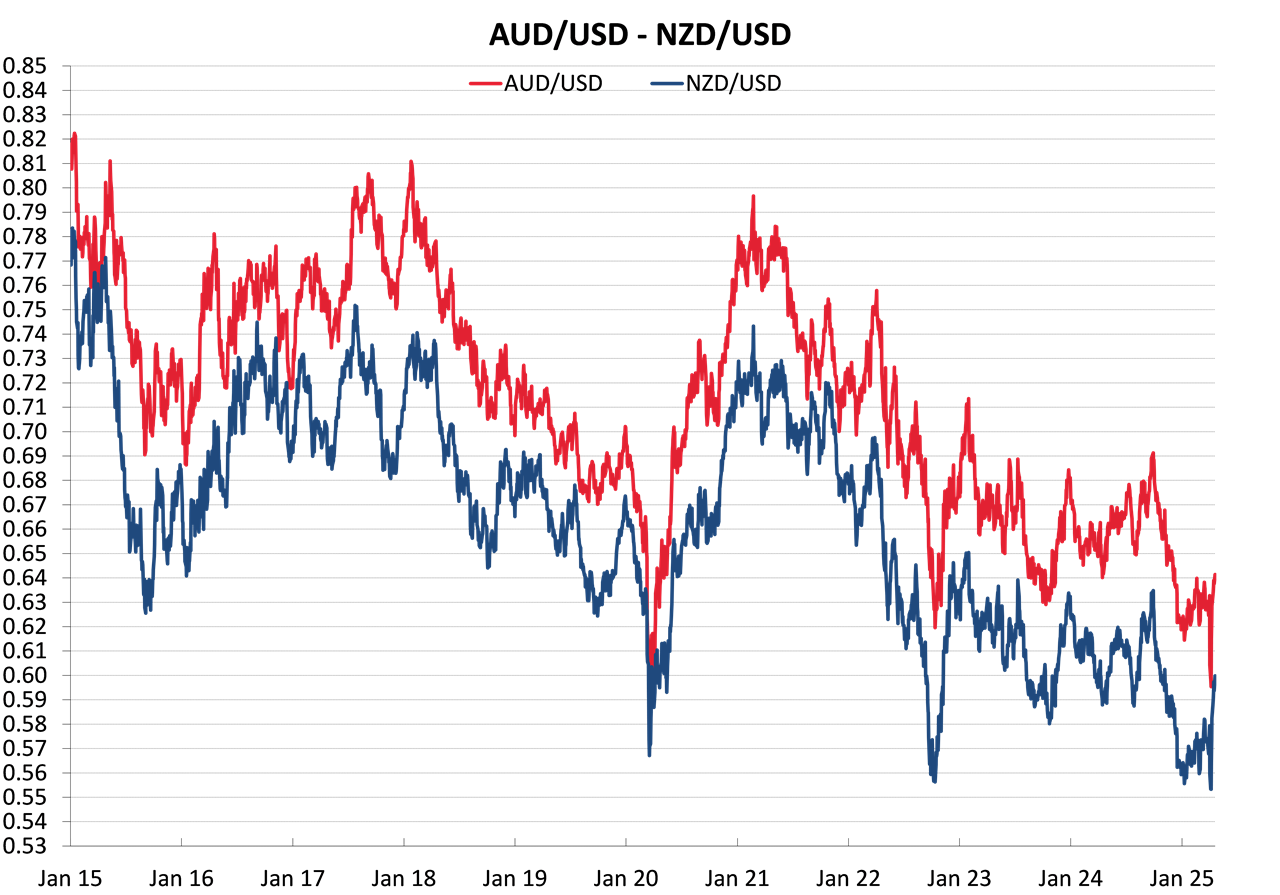
The NZD/USD exchange rate out-performance of the AUD/USD in the recent recovery from 0.5500 to 0.6000, has propelled the NZD/AUD cross-rate to above 0.9300. Over coming weeks, the Aussie dollar has the opportunity to regain that lost ground vis-à-vis the Kiwi dollar, sending the NZD/AUD cross rate back down again. Local AUD importers should be increasing hedging percentages at these attractive levels.
Over the last 10 years, the gap between the NZD/USD and AUD/USD exchange rates has averaged close to five cents (AUD above the NZD against the USD). Today that gap is just above four cents (AUD 0.6400 against NZD 0.5965). Therefore, the NZD/AUD cross-rate is currently elevated at 0.9320. A return to the five-cent difference would see the NZD/AUD cross-rate drop to the 0.9200’s.
Daily exchange rates
Select chart tabs
*Roger J Kerr is Executive Chairman of Barrington Treasury Services NZ Limited. He has written commentaries on the NZ dollar since 1981.
9 Comments
not sure what's worse -- the 5 attempts to log in before I can finally comment -- or the one dimensional anti trump rhetoric --
Your chart shows he was elected at 103.5 and its now 99and change -- so about 4% drop not 10 - 10 is from teh peak of his 100 days not the start
the Dow is only 3.5% down from when he announced tariffs -- which I reckon he would take given he has put 10% on everything 25 % on car parts, 20% on steel and TBH lost track on the China levels -- so moved the starting point for negotiations significantly and everybody is happy that the rest is on pause!
If you add in the increased spends on both his borders -- and hte huge increases in defence spending by EU nations -- plus all teh $$$ he is no longer contributing to world bodies that act largely against American interests -
Interesting that there is no sign his voters - the majority of Americans are unhappy -- whilst his opponents would still protest even if he ended poverty and created world peace -
reckon I wasted my subscription as huge drop in dialogue since it became a requirement to comment
Unfortunately I think the pull of the commentary from int.co readers has been severely underestimated.
There would be more comments if they were not disabled so often. I think this really needs to be sorted out. You can't ask readers to pay for the benefit of commenting, then having said comment's section not working properly. It happens much too often.
Agreed
Hi Kpnuts
I would recommend you check out at the 5:00 minute mark in the link below where CAF explains actions that are extremely dangerous and not just lethal for much of the global economy, but a giant threat to the freedom of the working classes as well.
In essence, the #47 Admin sets the stage for the most outrageous wealth transfer in history. Some of the groundwork for this heist was laid in Trump's first term too.
https://usawatchdog.com/stop-the-digital-control-grid-catherine-austin-…
It also explains how Trump's 'Genius Act' is potentially even more dangerous, in terms of bringing in centralised control, than CBDCs.
She explains how this works and how Trump #47 is justifying bringing in digital ID using the threat of voter fraud and immigration as an excuse.
Also how patently obvious it is that DOGE is largely a crock and is not going after the real targets, including at 17:00 - the reason the US has $37 trillion of public debt is that it is a debt-based economy. This is nuts, just as it is in all Western-centric economies.
If Admin #47 really wanted to go after the heart of the problem, they would work towards abolishing the Fed central bank cartel and issue the currency directly from the Treasury with no debt attached.
Also, she explains how Trump #45 ushered in FASAB 56 to take the books of the US government dark, allowing a shadowy group of insiders to remove items from the financial statements, and not have to disclose what they have removed.
https://www.thesiriusreport.com/economics/fasab-56-dollar-us-treasury/
There are a multitude of reasons why, not just long-time critics, but also supporters of Captain Chao$, should be holding his feet to the fire.
IMO Roger's excellent expose' is most certainly not overstated. The tragic reality is that Trump's behaviour is exponentially worse in both #45 and #47 Admins than most of us would dare to believe.
Regards
Colin
Interesting that there is no sign his voters - the majority of Americans are unhappy
You must not be following the polls;
Trump receives his best marks on border security, as a 55% majority approves. That’s the only issue where his ratings are in positive territory. On immigration, a record high of 47% approve of Trump (48% disapprove), while a new low of 38% approve on the economy (56% disapprove). His worst ratings are on inflation (33% approve, 59% disapprove), followed by tariffs (33%-58%), foreign policy (40%-54%), taxes (38%-53%), and guns (41%-44%).
And that's the Fox news poll :-).
https://www.foxnews.com/official-polls/fox-news-poll-first-100-days-pre…
The guy is a disaster and as the article points out it can only get worse. And, when the shelves start emptying at Walmart, Kmart and Costco....
Yeah, Kate - the Fox 'poll' - oh dear, how on Earth did I miss that!
Much like Trump's porkies - divide everything by at least a factor of 4.
But that doesn't work with the 200 tariff deals he claims to have made.
He is doing absolute wonders for the BRICS momentum - the dragon he claimed to have slain - in spite of not even knowing who they are.
YCHMTSU (not Japanese)
:-)
Although it is good news we ran a trade surplus in March which was the best since 2011, the ratio to GDP was a lot lower as GDP in 2011 was around 300bio (trade surplus 0.3% of GDP) whereas its about $425bio now (surplus 0.2%). Relativity is sometimes a better measure definitely in this case.
Roger has strong TDS. Always has had.
Really, according to Roger, it is amazing Trump won the election.
I just read that US PCE CPI was zero for March. Core PCE also zero.
The incredible thing is that it is nowhere in the media!! Why is that?
The Fed will cut interest rates.
The USD will recover. Foolish to bet against the USD.
We welcome your comments below. If you are not already registered, please register to comment
Remember we welcome robust, respectful and insightful debate. We don't welcome abusive or defamatory comments and will de-register those repeatedly making such comments. Our current comment policy is here.