


Affordability continued to improve for aspiring first home buyers in February - but only just.
The affordability of housing for typical first home buyers has been slowly but steadily improving since December 2023, but that improvement almost petered out in February this year.
There are three main influences on housing affordability: house prices, mortgage interest rates and after-tax incomes.
Overall there was a slight lift in prices at the bottom of the market last month, a slight fall in mortgage rates and a continuing small rise in incomes for typical first home buyers.
Let's look at each of those in turn.
House prices
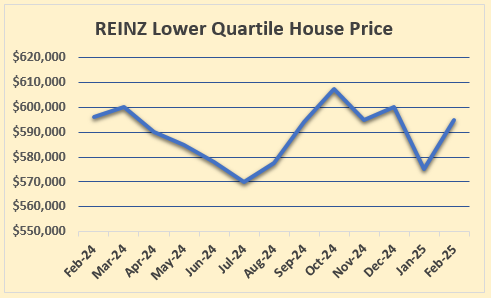
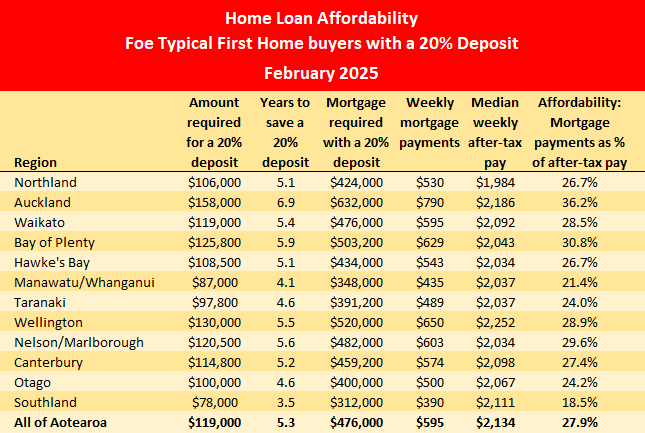
The Real Estate Institute of New Zealand's national lower quartile selling price was $595,000 in February this year.
That was up $20,000 compared to January, but barely changed from $596,000 in February last year.
While lower quartile prices have marched back from their record high of $670,000 set in November 2021, over the last 12 months the lower quartile has tended to bounce around within a fairly narrow price band.
So while there are small monthly movements in the lower quartile price, we are yet to see a strong trend emerge, either up or down, as shown in the graph below.
Mortgage interest rates
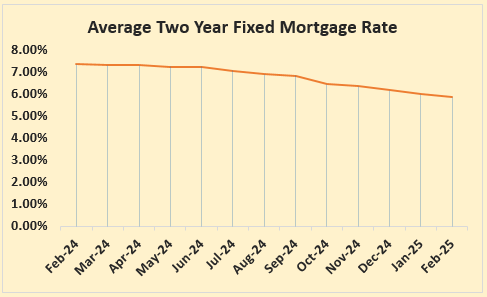
Mortgage interest rates have been in steady decline for more than a year now, with the average of the two year fixed rates charged by the main banks dropping from 7.04% in November 2023 to 5.09% in February this year.
With house prices showing little sign of meaningful movement, it is the lower interest rates more than anything else that have driven the recent improvements in affordability for first home buyers.
Incomes
Incomes are the other side of the affordability coin, although they receive a lot less attention than either house prices or interest rates.
Interest.co.nz tracks after-tax pay rates for people aged 25-29 to use in its affordability measures for first home buyers, because many general measures of affordability include large swathes of the population such as retirees and welfare beneficiaries who are generally not in the market for their first home.
We believe this provides a more realistic measure of affordability for genuine first home buyers.
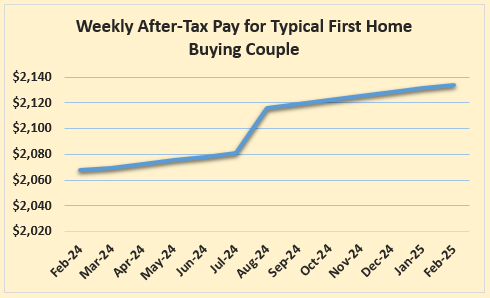
Their incomes have been rising, but slowly.
The estimated, combined after-tax pay for a couple aged 25-29 with both working full time, increased from $2068 a week in February last year to $2134 in February this year.
That's an extra $66 a week, helped by a little tax cut in the middle of last year.
With no signs of further tax cuts on the horizon, general living costs remaining high and an abundance of economic uncertainties, we don't expect there to be any significant improvements in incomes in the near future that would impact housing affordability.
Conclusion
The housing market is a dynamic one, but affordability for first home buyers appears to be flattening out for the time being.
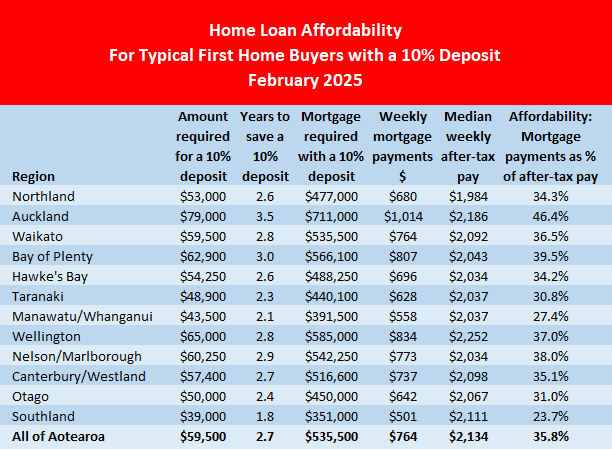
That follows some significant improvements in affordability over the last year or so, which means housing should be affordable for first home buyers on average incomes in most parts of the country.
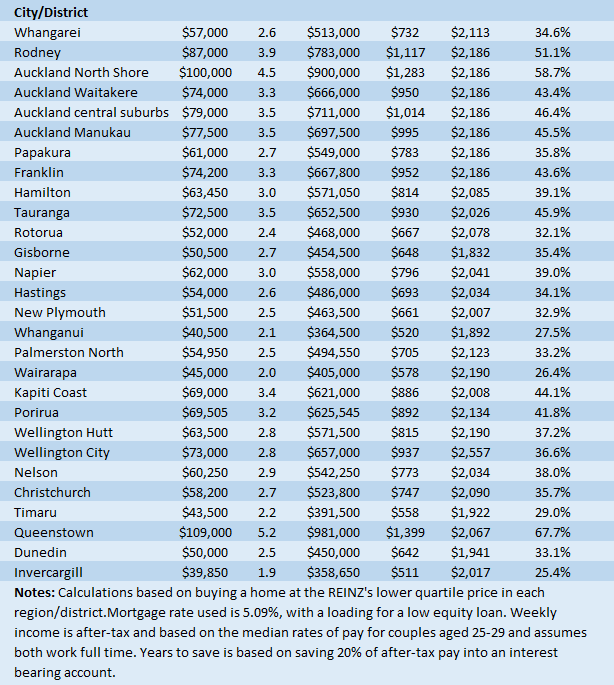
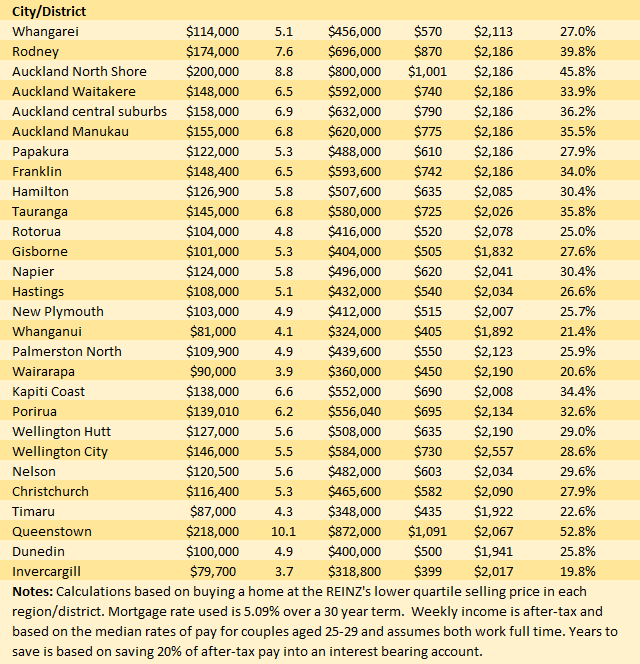
However, there are still some major pressure points for hopeful first for first home buyers in Auckland, Tauranga, Kapiti Coast and Queenstown, where even prices at the bottom end of the market are so high they are likely out of reach for those on average incomes.
The tables below show the main affordability measures for typical first home buyers with either a 10% or 20% deposit, in the main regions and urban districts throughout the country.
The comment stream on this article is now closed.
*This article was first published in our email for paying subscribers on Friday. See here for more details and how to subscribe.
4 Comments
Very useful analysis.
It would be useful to consider the mix of housing in the lower quartile. In Auckland that may include a lot of townhouses. Which supports the theory that it is all about supply. And while some criticize town houses they are warm, dry, double glazed and no maintenance surprises in the future.
When your house is joined to your neighbor there will always be maintenance surprises.
Even when its just a shared fence there are so many issues re maintenance.
From my back-of-an-envelope numbers, the income to price ratio is about 1:7 for Auckland, 1:9.2 in Queenstown and 1:5 in Dunedin.
Is that right? If so, it's something of a change, but given the impact of the increased cost of everything else on disposable income, is affordability actually improving that much?
Would appreciate it interest.co.nz could update their median multiple chart.
We welcome your comments below. If you are not already registered, please register to comment
Remember we welcome robust, respectful and insightful debate. We don't welcome abusive or defamatory comments and will de-register those repeatedly making such comments. Our current comment policy is here.