
Summary of key points: -
- Inconsistent and fickle Fed members’ “dot-plot” interest rate forecasts causing US dollar volatility
- Big four paradigms that shift the US dollar’s value
- Undervalued Aussie dollar attracting industry players into cross-border investment
Inconsistent and fickle Fed members’ “dot-plot” interest rate forecasts causing US dollar volatility
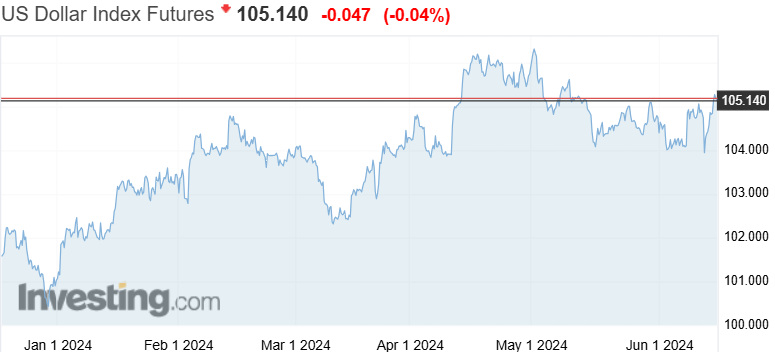
The US dollar strengthened back to above 105 on the USD Dixy Index last week following a marginally more hawkish monetary policy statement from the US Federal Reserve, against what the markets were expecting beforehand.
Because of the USD rebounded back upwards following the Fed meeting, the Kiwi dollar has recoiled somewhat to 0.6150 by the weeks’ end on Friday 14th June from a high of 0.6220 reached on Wednesday night following a lower-than-expected US CPI inflation increase for the month of May. Over recent months, (as the chart of the USD Index displays below), forays higher by the USD to the 105 area have not been too long lasting as subsequent economic data is released indicating a softening in inflation or employment numbers that drives market interest rates lower, which in turn weakens the US dollar. On the other side, the bouts of USD gains to the 105 and 106 area have been due to stronger than anticipated inflation and/or employment data which automatically shifts interest rate market pricing to Fed interest rate cuts coming later rather than sooner (USD positive).
Reflecting on the US inflation and employment results since the start of 2024 and the related up and down USD movements, leads to a conclusion that the individual Fed members with their individual quarterly “dot-plot” interest rate forecasts have been as schizophrenic (unpredictable, fickle, changeable and inconsistent) as the interest rate and FX markets, in wildly adjusting their outlook on the latest piece of economic data it seems. Fed Chair, Jerome Powell repeatedly tells the markets that the Fed themselves look at all economic data “in aggregate” and “in totality” and do not react to individual pieces of data as they want to see trends over time. However, despite those reassurances from Chair Powell, the latest “dot-plot” interest rate forecasts from individual Fed members pushing out the previous three interest rate cuts in 2024 to somewhere between one and two cuts, smacks of a short-term, knee jerk reaction to the strong +278,000 Non-farm Payrolls (“NFP”) jobs increase for May released on Friday 7th June. The Fed members would not have had time to adjust their forecasts to the weaker than expected CPI inflation numbers for May released earlier in the day before the Fed meeting on Wednesday 12th June. Headline inflation for May was 0.00%, below the 0.10% expected by prior consensus forecasts. The core inflation increase came in at a 0.20% increase, below the +0.30% expected. On the softer inflation news, the US dollar tumbled to 103.88 (allowing the NZD/USD rate to reach 0.6220), only to reverse back up to 105.14 following the Fed meeting.
Whilst both US inflation and employment results were stronger than expected over the first three months of this year (for reasons we have previously canvassed), the data for April and May has been considerably more mixed. NFP jobs data has been volatile with a weak number in April, but a surprisingly strong result in May. Other measures of the labour market and jobs have all been weaker for May, so the May NFP appears to be rogue result which will be revised substantially lower next month. The USD Index has followed the pattern of stronger inflation and jobs data in January, February and March, appreciating from 101 to 106. However, through April, May and June the “mixed” inflation and jobs results have caused the more volatile and indecisive pattern of the USD bouncing up and down between 104 and 106.
We do believe that the latest spike back up in the USD Index to 105 will last for very long, as the US 10-year bond yields have not over-reacted to the "dot-pot” interest rate forecast increases as the FX markets have. The 10-year bond yield has reduced from 4.48% a week ago to 4.22% today, pricing in the softer inflation data and ignoring the “dot-plot” changes altogether. It is likely that it will only take a few days for the FX markets to catch up with the lower trending bond yields and therefore sell the USD Index to back below 104.
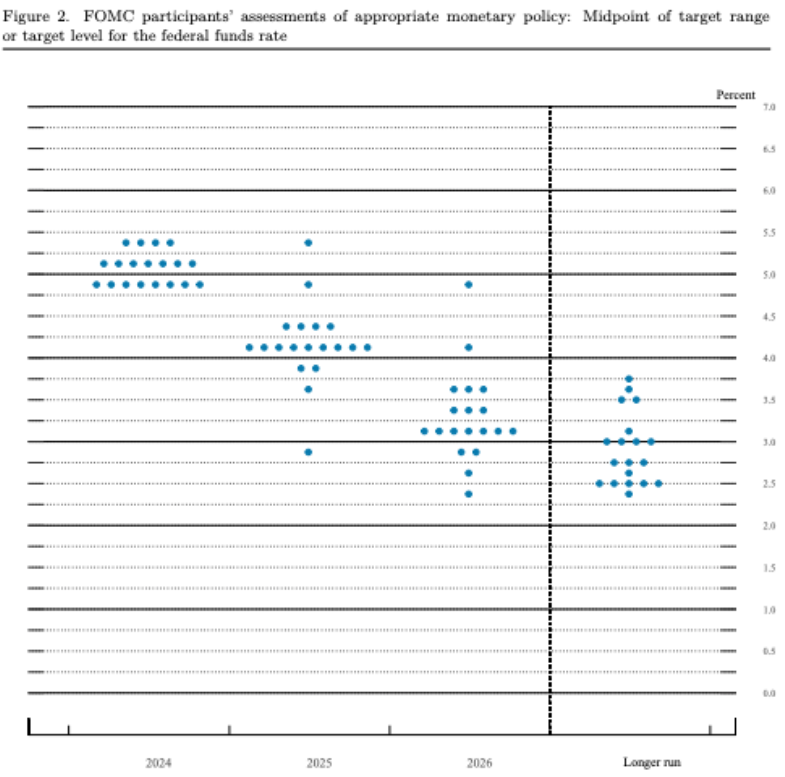
It is instructive to examine the individual Fed member’s “dot-plot” interest rate forecasts. The 19 individual interest rate forecasts are anonymous; however, the analysis shows that four Fed members are perennial “hawks” and they have consistently forecast zero interest rate cuts in 2024. Eight members have forecast two cuts before the end of 2024 and seven members have forecast just one 0.25% cut. Unfortunately for USD bears such as us, the four “hawks” in the Fed (Mester, Bowman, Waller and Barkin) make up a sizeable part of the 12 FOMC voting members. Therefore, it is going to take consistently weaker inflation and employment data over coming months to convince the four hawks in the FOMC that US monetary policy is being held unnecessarily tight at “very restrictive” levels of 5.50% and will damage the economy unless they cut rates. The positive news for the Kiwi dollar (negative for the USD value) is that there is a growing probability that the US economic data will be uniformly weaker over coming months. The Fed say they need more confidence about inflation moving lower to their 2.00% target before they will cut interest rates. Expected sharp reductions in the preferred PCE inflation index in May and June should deliver that confidence to act.
Despite the hesitancy from most members of the Fed to make several 0.25% interest rate cuts in 2024, as the “dot-plot” chart below confirms, sizeable cuts down to 4.25% are expected in 2025. The FX markets, as they always do, will therefore start to price in the 2025 reductions well in advance of time, resulting in USD selling over coming months.
Big four paradigms that shift the US dollar’s value
In FX market circles there is often much discussion around whether and when the US dollar will lose its crown as the dominant reserve currency of the world that many prefer to hold their investment assets in. Over recent years, governments, central banks and sovereign wealth funds (e.g. China and Norway) have diversified their currency risk slightly away from the US dollar as it has gained strength from rising US interest rates. They have taken advantage of the USD appreciation to switch into alternative currencies or other stores of wealth such as gold.
Looking ahead over coming years, the ‘big picture” view is that there are four broad paradigms that determine the US dollars value: -
- Global geo-political risk factors: The USD is always in demand as a safe-haven currency to go to in times of global geo-political stress and tension. In recent times it has been the Russian/Ukraine and Israel/Hamas wars that have caused some flight to safety into the USD. However, the USD has already reacted to these events and the risk pressures have not escalated and seem unlikely to. Over the next 12 months the FX markets are perhaps more likely to see unwinding of long-USD positions from the past than new long positions established. The current global trend to more right-wing and far-right political wins is unlikely to increase geo-political risk on the US dollar value.
- Relative economic performance: At the end of the day this always determine one currency’s value against another currency. The US economy has outperformed others in the post-Covid era (particularly China and Europe), hence some justification for the stronger USD. However, the gap today is closing as other major economies recover into more positive GDP growth, whereas many indicators suggest the US economy may now be stalling under the weight of delayed and their very restrictive monetary conditions.
- Interest rate differentials: The “negative carry” (or cost) to hold a currency that has a lower interest rate compared to your home currency (say the USD) is always a factor in exchange rate levels and values. The Australian dollar has really suffered from this in recent years as their interest rates were only increased to 4.35% to combat high inflation, well below US interest rates at 5.50%. However, FX markets always tend to price-in expected future interest rate differentials much more than current interest rate differentials. Australian and New Zealand interest rates are unlikely to be cut to well into 2025, whereas US interest rate cuts will be occurring over coming months. The Chinese Yuan has been unable to recover to below 7.00 to the USD as their interest rates remain well below those of the US.
- Energy and commodity prices: The long-standing paradigm that the USD value moves inverse to energy and commodity prices is under scrutiny currently. The previous inverse relationship was based on oil and commodity prices in local (non-USD) currency terms could not move to extreme high levels as it could cause massive inflation in oil importing countries (Japan and Europe) or to extreme low levels as to cause economic failure in commodity exporting countries. The USD/oil price relationship over the last 12 months has been that the USD has followed (correlated with) oil prices higher and lower as oil prices impact US inflation and interest rates. The dominance of US economic factors over the USD value in this high interest rate environment has turned the paradigm on its head. The influence of commodity export prices on the NZD and AUD values over recent years has been diluted away by the overpowering interest rate differential in favour of the USD.
Depending on the US Presidential election result in November, global trade tensions loom as the next major threat in terms of geo-political risks. American corporate CEO’s who met with Republican Party candidate Donald Trump recently were surprised at his “meandering thoughts” and “all over the shop” presentation, may be reviewing the benefits of having “The Donald” back in the White House. There is more water to go under this bridge over coming months.
Undervalued Aussie dollar attracting industry players into cross-border investment
One measure of when a particular currency is viewed as undervalued is when you witness numerous cross-border Mergers and Acquisitions transactions taken place as target companies become attractive to global industry players. The lower value of the Australian dollar over recent years has now starting to drive offshore buying of some iconic Aussie businesses. Building materials company CSR has agreed to a AUD4.5 billion takeover bid by France’s Cie. De Saint-Gobain. Listed cement make Adbri (Adelaide Brighton Cement) has agreed to a AUD2.1 billion buyout by Irish giant CRH. The Irish buyers tellingly citing the low value of the AUD currency as a major factor in their decision to buy at this time. Across-border capital flows (foreign direct investment) that are large and concentrated will always have an impact on currency values as they are over and above the normal currency flows from trade and portfolio investments of fund managers. Massive capital inflows into Australia a decade ago in 2013/2014 related to offshore buying and expanding of mining resources propelled the Aussie dollar to a higher of $1.07 against the USD. At almost half that value today at 0.6600, there are pretty good odds that we will see another wave of global capital flows coming into undervalued AUD denominated assets/companies.
A potential change back to a more business-friendly centre-right Government in Australia before next May and lower Australian interest rates in 2025 would add to the attraction for foreign buyers. Look out for more iconic Australian company names being gobbled up global industry players.
Daily exchange rates
Select chart tabs
*Roger J Kerr is Executive Chairman of Barrington Treasury Services NZ Limited. He has written commentaries on the NZ dollar since 1981.
3 Comments
Thank you for the excellent analysis.
Worth nothing that the USD share of fx reserves has now fallen under 60% i.e. countries are gradually diversifying out of the USD and possibly even more so now that the dollar is being used as a geopolitical weapon by Washington DC.
Roger - respectfully your analysis of the voting US FOMC members predictions of the end of year Fed Funds rate does not provide any analysis of the longer term projections. I believe these are less subject to the recency bias that most of us have when looking at such things as economic data releases. The longer-term projections of the fed funds rate have been edging up. I use “edging up” loosely because a shift of 10 basis points between one set of projections and another is quite significant for the longer term picture. The central point of those projections is now at 2.9% when not so long ago it was closer to 2.5%. The central point does not weight individual projections and those voting members do change over time but nonetheless this is a forecast that I believe is worth tracking more closely.
We welcome your comments below. If you are not already registered, please register to comment
Remember we welcome robust, respectful and insightful debate. We don't welcome abusive or defamatory comments and will de-register those repeatedly making such comments. Our current comment policy is here.