Home loan affordability improved slightly across most of New Zealand in June after a fall in median house prices more than offset a rise in interest rates.
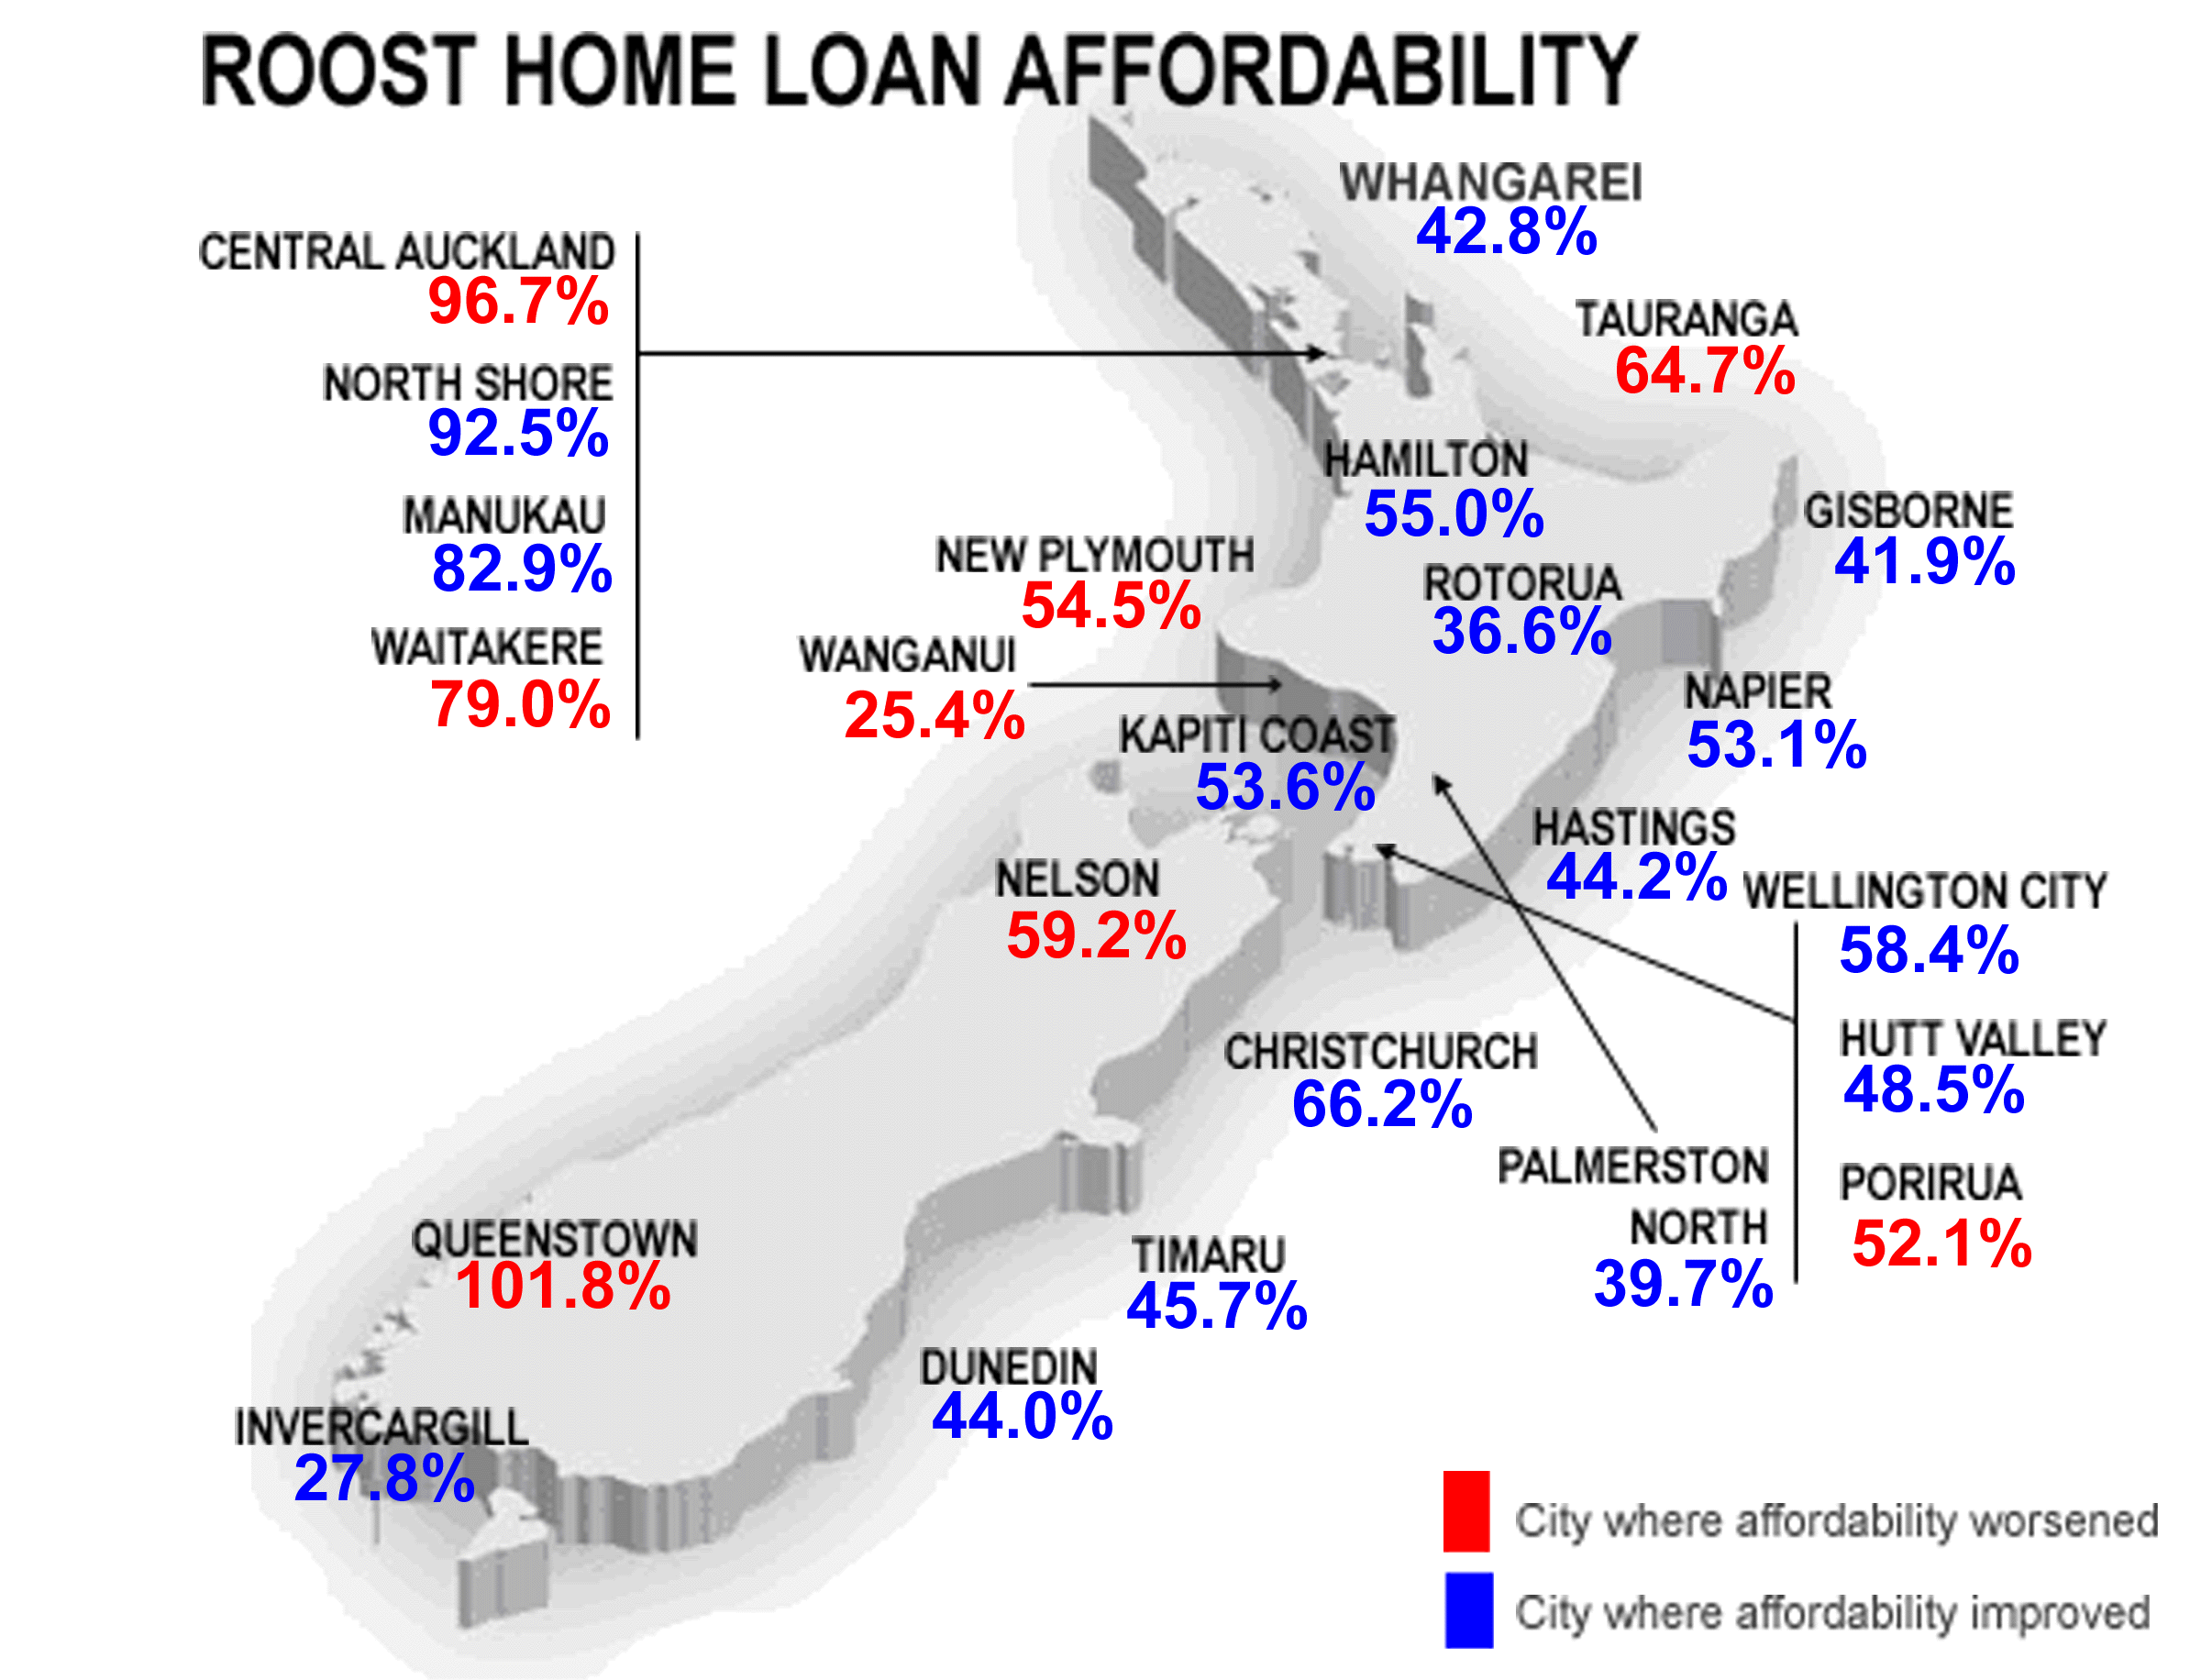
The Roost Home Loan Affordability Reports showed an improvement in 16 of 24 regions, including on the North Shore and in South Auckland.
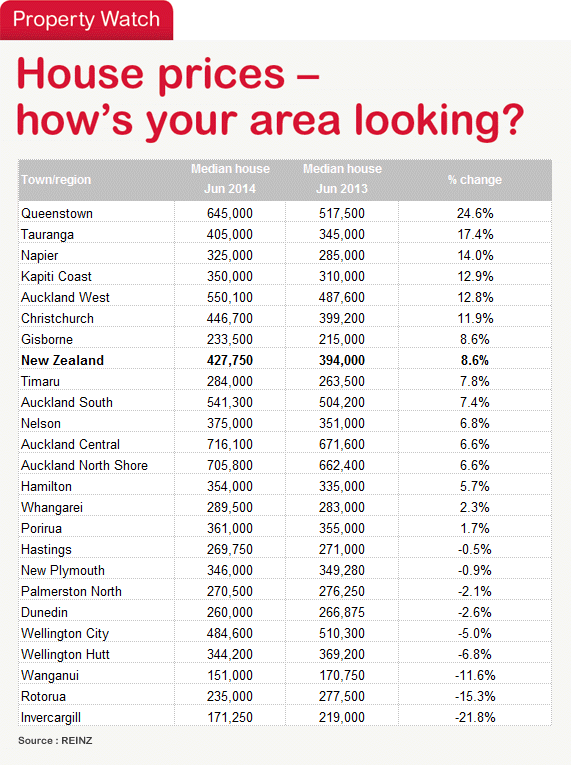
A 0.6% fall in the national median house price in June and a slight rise in wages was just enough to compensate for increases in floating mortgage rates over the month.
The Roost Home Loan Affordability reports show national affordability improved to 62.6% in June from 63.1% in May after the national median house price fell to NZ$427,250 in June from NZ$432,000 from May.
Average floating mortgage rate rose to 6.42% from 6.23% a month earlier, although fixed rates rose by less and are now significantly below floating rates.
The Roost reports have been referred to repeatedly in and out of Parliament in recent months as the debate over housing affordability heats up before the September 20 election.
Banks have been more aggressive in recent months in offering cut-rate longer-term fixed mortgage rate deals, passing on the benefits of low international and local funding costs. Fixed mortgage rates have held just above 6% through June and July and are now well below floating rates of over 6.5%. Floating rates are expected to rise over 6.7% after the Reserve Bank's rate hike on Thursday.
"The rise in floating mortgage rates in recent months has shaken up the market," said Roost Home Loans spokeswoman Colleen Dennehy. "Banks are offering many and varied fixed rate deals and incentives, which a broker can help a borrower navigate," Dennehy said.

The Roost Home Loan Affordability reports for June showed affordability for regular home buyers improved in 16 cities and regions, including North Shore, Manukau, Whangarei, Hamilton, Dunedin and Invercargill. Affordability deteriorated in central Auckland, Waitakere, Wanganui and Queenstown as house prices rose.
It was toughest for first home buyers on the North Shore of Auckland, where it took 109.5% of a single median after tax income to afford a first quartile priced house, albeit down from 109.9% the previous month.
Housing affordability has become a major economic and political issue over the last 18 months. The Reserve Bank and Government agreed on a toolkit of 'macro-prudential' controls that would see the central bank impose limits growth in high LVR mortgages. Central and local governments are also moving to address housing supply shortages. The Reserve Bank's speed limit was applied on October 1 and it said in its June Monetary Policy Statement it appeared to have worked to reduce house price inflation by around 2.5 percentage points.
For first home buyers – which in this Roost index are defined as a 25-29 year old who buys a first quartile home – there was a worsening in affordability in 11 of the 24 regions covered and the national measure also worsened because of a rise in the cheapest quartile of houses.
It took 51.4% of a single first home buyer's income to afford a first quartile priced house nationally, up from 51.3% a month earlier. The most affordable city for first home buyers was Invercargill, where it took 20.4% of a young person's disposable income to afford a first quartile home. The least affordable was North Shore at 109.5%.
Any level over 40% is considered unaffordable, whereas any level closer to 30% has coincided with increased buyer demand in the past.
For working households, the situation is similar, although bringing two incomes to the job of paying for a mortgage makes life considerably easier. A household with two incomes would typically have had to use 41.0% of their after tax pay in June to service the mortgage on a median priced house. This is down from 41.4% the previous month.
On this basis, most smaller
For first-home buying households in the 25-29 age group (which are assumed to have no children), affordability nationally was unchanged at 24.9% of after tax income in households with two incomes required to service the debt. The lower quartile house price rose to NZ$287,750 from NZ$287,000 the previous month.
Any level over 30% is considered unaffordable in the longer term for such a household, while any level closer to 20% is seen as attractive and coinciding with strong demand.
First home buyer household affordability is measured by calculating the proportion of after tax pay needed by two young median income earners to service an 80% home loan on a first quartile priced house.
---------------------------------------------------------------------------------------------------------------------------------------
Mortgage choices involve making a significant financial decision so it often pays to get professional advice. A Roost mortgage broker can be contacted by following this link »
---------------------------------------------------------------------------------------------------------------------------------------
No chart with that title exists.
Full regional reports are available below:
2 Comments
It is one thing to assess drivers like median price and income increases when viewing affordabiity......
However the following costs are not going to go away if there is a genuine shortage in housing which has been driving prices upwards when we talk about issues of affordability. If a home company is involved in a project they will also have their overhead costs built into the project....after all they run offices and organise people too.
While there are the obvious costs of labour and materials that go into housing there is also the Overheads that a builder has.....and they are not reducing and these are just some that every builder will face.
OVERHEADS
Advertising
Office Expenses
- Staff
- Office Equipment
- Telephone
- Computer
- Office Supplies
- Electricity
- Rent on office
There is invoicing, GST, quotes, dealiing with suppliers and sub-contractors, Council, Ordering from suppliers, tracking producer statements, preparing information for accountant, banking, sorting contracts, payment schedules, wages, paying sub-contractors etc to deal with.
Job Expenses
- Vehicles
- Job Supervision
- Tools and Equipment
- Service and Call backs
- Cell phone expenses
- Camera's and other recording features.
- Storage
Can't do too much if you can't get to a site, have the tools, provide the service, customer contact, take calls and T up everything that is occurring daily and keep in touch with the office and your customer, and you have to have somewhere to put all the tools and equipment, trailers, scaffold etc.
General Expenses
- Owners Salary
- Insurances
- Bad Debts
- Operating Capital Reserve Account
- Interest
- Licensing and Fees
- Accountancy Fees
- legal Fees
- Education and Training
- Association Fees
- OSH Site Safe or whatever your preference.
Now I have put the Owners Salary in here as there will be many times he/she is not on site and so the hours are not part of the direct labour rate on the job site.
This is by no means a full list of Overheads but I hope your getting the picture as all of these costs exist on top of Labour, Materials, and other specialist equipment/hirage like scaffolding.
Now the value of all this to the NZ economy is quite significant and as you can see quite a few people are reliant on people who build houses. Now just stop and think about it because every builder, plumber, drainlayer, electrician, roofer, tiler or any other sub-contractor involved has all these same overhead costs in their business.
And I should have added in some of the following:
- ACC
- Kiwisaver
- 4 weeks annual leave, stat holidays, sick pay etc.
I hope readers are getting the picture that Overheads are completely out of control......


We welcome your comments below. If you are not already registered, please register to comment
Remember we welcome robust, respectful and insightful debate. We don't welcome abusive or defamatory comments and will de-register those repeatedly making such comments. Our current comment policy is here.