

The days of buying a stand alone, three bedroom house as a residential property investment may be drawing to close, with interest.co.nz's second quarter update of indicative rental yields and cash flows showing the yields for investors on three bedroom houses are poor and the cash flows they're likely to generate are even worse.
The figures also show investors are likely to find much more attractive options among multi-unit properties such as apartments and home units.
Interest.co.nz tracks the Real Estate Institute of New Zealand's lower quartile selling prices for the three main types of residential investment properties; three bedroom houses, two bedroom apartments/units, and one bedroom apartments/units, in each of the country's main urban areas and updates them quarterly.
These are then matched with the weekly rents charged for new tenancies in the same types of properties in the same districts over the same time period.
Those figures are used to provide a gross indicative yield for these types of properties in each area.
Interest.co.nz also calculates how much money would be left over from the rental income once mortgage payments on the properties were paid, assuming the mortgage was for 60% of the purchase price and over a 20 year term, to give an idea of likely cash flow. - both sets of figures are displayed in the tables below.
Both figures suggest three bedroom houses are likely to provide investors with pretty poor returns.
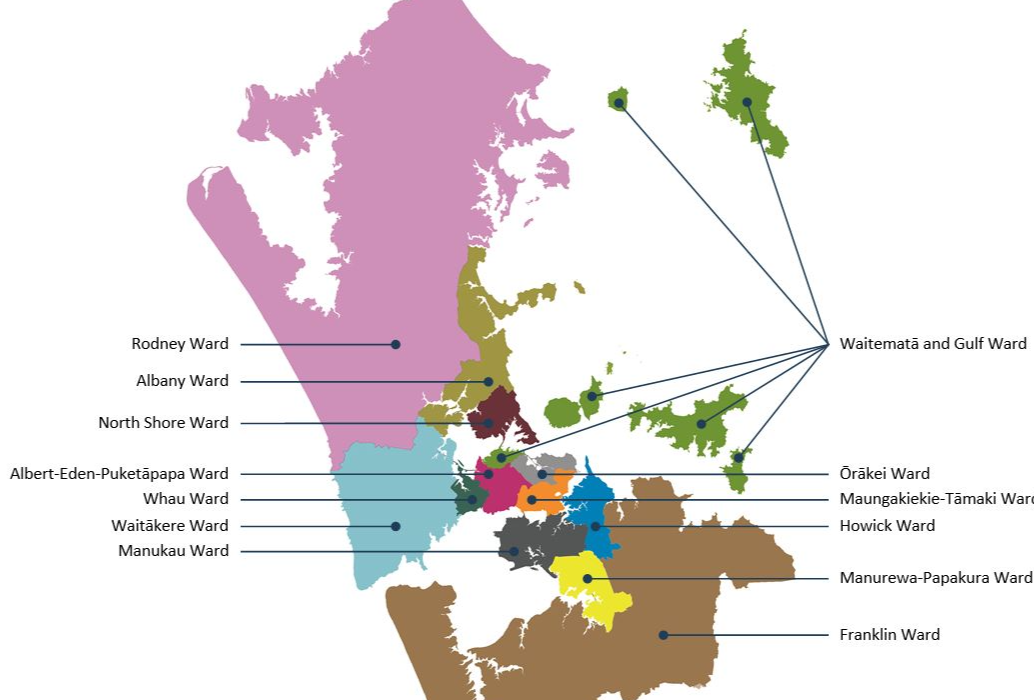
The gross yields on three bedroom houses ranged from 3.4% in the Waitemata & Gulf and Orakei wards in Auckland City, to 6.8% in Invercargill (see the map below for the location of Auckland Council wards).
Whanganui, Dunedin and Invercargill were the only districts where the yields were above 6%.
The yields for three bedroom houses were particularly low in Auckland, averaging 4.6% across the region, and ranging from 3.4% in the Waitemata & Gulf ward to 5.2% in the Manurewa-Papakura ward.
The average yield across the entire country for three bedroom houses was 5.8%.
While the yield figures suggest pretty meagre returns, the cash flow figures are disastrous.
Of the 40 urban districts tracked by interest.co.nz, 18 would have produced negative cash flows once the mortgage was paid (three bedroom houses only).
Essentially the rent would not have been enough to cover the mortgage payments, assuming the mortgage was on the terms outlined above.
The cashflows ranged from minus $553 a week in Auckland's Waitemata & Gulf ward, to plus $103 a week in Invercargill.
And even those places where cash flow was positive would probably be looking at negative cash flows once other expenses such as rates, insurance, repairs, maintenance and periods of vacancy are factored in.
Those figures suggest that anyone buying a three bedroom house as an investment in the second quarter this year was probably having to put their hand in their pocket to meet the outgoings in the hope of making a capital gain at a later stage, and that probably hasn't gone to well for them recently.
However, both the yields and cash flows for multi-unit dwellings look much more favourable for investors.
The average gross yield for two bedroom units was 7.3% nationally in the second quarter, and gross cashflow was a positive $159 a week.
That still wouldn't leave much to play with once the non-mortgage expenses are paid and an extended period of vacancy could be disastrous, so it should probably be described as marginal, but at least its not underwater.
The stars of the show for investors are one bedroom units.
On average these provide an average gross yield of 11.1% and average gross cash flow, after mortgage payments but before other outgoings, of $238 a week.
At that rate investors might even make a few pennies.
The comment stream on this story is now closed.
| Indicative Gross Rental Yields & Gross Cash Flows | ||||||
| For Residential Investment Properties | ||||||
| By Main Housing Types | ||||||
| Q2 2024 | ||||||
| District | Three Bedroom House | One bedroom unit/apartment | Two bedroom unit/apartment | |||
| Gross Rental Yield | Gross weekly cash surplus/deficit after mortgage paid | Gross Rental Yield | Gross weekly cash surplus/deficit after mortgage paid | Gross Rental Yield | Gross weekly cash surplus/deficit after mortgage paid | |
| Whangarei District | 5.8% | $45 | 8.2% | $137 | 6.3% | $70 |
| Auckland Region | 4.6% | -$128 | 15.4% | $313 | 5.7% | $37 |
| Rodney Ward | 3.8% | -$265 | ||||
| Albany Ward | 4.2% | -$201 | 5.1% | -$27 | 4.7% | -$84 |
| North Shore Ward | 4.1% | -$231 | 5.4% | $7 | 4.5% | -$129 |
| Waitakere Ward | 4.5% | -$124 | 4.4% | -$97 | 4.9% | -$52 |
| Waitemata and Gulf Ward | 3.4% | -$553 | 24.8% | $376 | 22.1% | $470 |
| Whau Ward | 4.2% | -$187 | 8.7% | $176 | 5.2% | -$13 |
| Albert-Eden-Puketapapa Ward | 3.6% | -$385 | 6.0% | $54 | 5.2% | -$17 |
| Orakei Ward | 3.4% | -$491 | 5.8% | $40 | 4.4% | -$139 |
| Maungakiekie-Tamaki Ward | 4.0% | -$266 | 6.1% | $62 | 5.6% | $32 |
| Howick Ward | 3.8% | -$312 | 4.9% | -$47 | 5.0% | -$51 |
| Manukau Ward | 5.1% | -$42 | 5.9% | $40 | 5.9% | $56 |
| Manurewa-Papakura Ward | 5.2% | -$27 | 5.5% | $13 | ||
| Franklin Ward | 4.7% | -$97 | ||||
| Hamilton City | 5.2% | -$25 | 5.7% | $18 | 5.1% | -$24 |
| Taupo District | 5.4% | $5 | ||||
| Tauranga City | 5.0% | -$46 | 5.3% | -$9 | 5.8% | $52 |
| Rotorua District | 6.0% | $60 | 7.5% | $156 | ||
| Whakatane District | 5.4% | $2 | 5.0% | -$32 | ||
| Hastings District | 5.9% | $58 | 5.8% | $38 | ||
| Napier City | 5.6% | $33 | 8.6% | $218 | ||
| New Plymouth District | 5.9% | $57 | 8.5% | $138 | 6.0% | $49 |
| Whanganui District | 6.4% | $82 | 7.6% | $103 | ||
| Palmerston North City | 5.7% | $40 | ||||
| Kapiti Coast District | 5.4% | N/A | 5.2% | -$25 | ||
| Porirua City | 0.0% | N/A | 7.4% | $195 | ||
| Upper Hutt City | 5.7% | $41 | 5.6% | $19 | ||
| Lower Hutt City | 5.8% | $54 | 8.4% | $170 | 6.6% | $115 |
| Wellington City | 4.9% | -$76 | 7.8% | $147 | 6.8% | $132 |
| Nelson City | 5.3% | -$9 | 5.8% | $29 | 5.7% | $26 |
| Marlborough District | 5.5% | $10 | 4.5% | -$31 | ||
| Waimakariri District | 4.9% | -$54 | 0.0% | -$108 | ||
| Christchurch City | 5.3% | -$9 | 7.8% | $134 | 6.4% | $87 |
| Selwyn District | 4.8% | -$68 | ||||
| Ashburton District | 5.7% | $26 | 0.0% | -$289 | ||
| Timaru District | 5.6% | $18 | 0.0% | -$449 | 5.2% | -$10 |
| Queenstown-Lakes District | 3.8% | -$354 | 9.1% | $225 | 6.4% | $121 |
| Dunedin City | 6.1% | $74 | 6.5% | $71 | 7.4% | $131 |
| Invercargill City | 6.8% | $103 | 8.6% | $152 | ||
| All of Aotearoa | 5.8% | $47 | 11.1% | $238 | 7.3% | $159 |
| Notes: All indicative yields are based on the REINZ's lower quartile selling price and Tenancy Services median rent for each property type in each district for Q2 2024. Where a field is vacant, it is because there were insufficient sales/tenancies for that type of property to produce a reliable yield/cash flow figure. All figures are gross and do not include any allowance for insurance, rates, repairs, maintenance or other expenses or periods of vacancy. Figures are based on properties being purchased with a 40% deposit and 60% mortgage. Mortgage interest rate used was 6.50% with a 20 year term. | ||||||
Auckland Council Wards
- You can have articles like this delivered directly to your inbox via our free Property Newsletter. We send it out 3-5 times a week with all of our property-related news, including auction results, interest rate movements and market commentary and analysis. To start receiving them, register here (it's free) and when approved you can select any of our free email newsletters.
We welcome your comments below. If you are not already registered, please register to comment
Remember we welcome robust, respectful and insightful debate. We don't welcome abusive or defamatory comments and will de-register those repeatedly making such comments. Our current comment policy is here.