Table 1: Gold has had double digit returns across major currencies

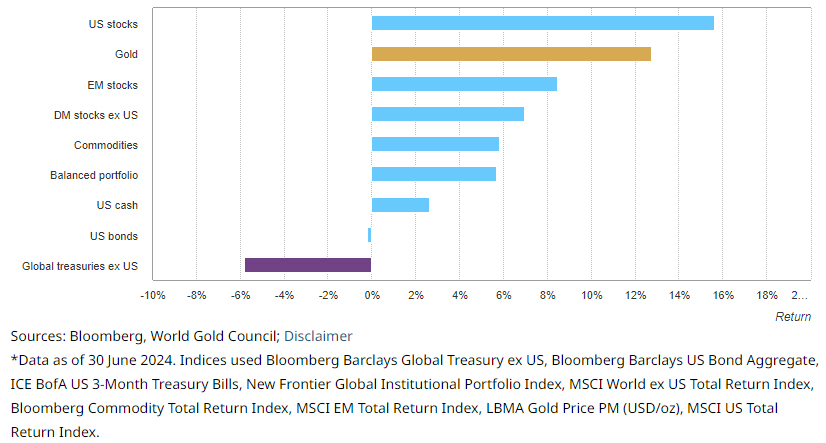
Gold has performed remarkably well in 2024, rising by 12% y-t-d and outpacing most major asset classes. Gold has thus far benefitted from continued central bank buying, Asian investment flows, resilient consumer demand, and a steady drumbeat of geopolitical uncertainty. As we look forward, the key question in investors’ minds is whether gold’s momentum can continue or if it’s running out of steam.
With a few exceptions, the global economy is showing wavering growth indicators – eager for rate cuts – amid lower but still uncomfortable inflation. And the market’s outlook is not too dissimilar. Our analysis suggests that the gold price today broadly reflects consensus expectations for the second half of the year. However, things rarely go according to plan. And the global economy, as well as gold, seem to be waiting for a catalyst.
For gold, we believe the catalyst could come from falling rates in developed markets, that attract Western investment flows, as well as continued support from global investors looking to hedge bubbling risks amid a complacent equity market and persistent geopolitical tensions.
Gold’s outlook is, of course, not without risks. A sizable drop in central bank demand or widespread profit-taking from Asian investors could curtail its performance.
As it stands, however, global investors continue to benefit from gold’s role in robust asset allocation strategies.
Chart 1: Gold remains one of the best performing assets of 2024
Y-t-d returns for gold and key asset classes in USD*
Table 1: Gold has had double digit returns across major currencies
Performance of gold in various currencies*
| USD (oz) | EUR (oz) | JPY (g) | CAD (oz) | INR (10g) | RMB (g) | AUD (oz) | |
| H1-end price | 2,331 | 2,176 | 12,057 | 3,190 | 62,440 | 545 | 3,492 |
| H1 average price | 2,203 | 2,038 | 10,795 | 2,994 | 58,944 | 511 | 3,347 |
| Y-t-d return | 12.1% | 15.9% | 27.8% | 16.1% | 12.3% | 14.6% | 15.0% |
Source: Bloomberg, ICE Benchmark Administration, World Gold Council
*As of 28 June 2024. Based on the LBMA Gold Price PM in USD, expressed in local currencies.
Setting the record straight
Gold has made headlines this year, breaking record highs multiple times between mid-March and mid-May. At the time of writing, gold is up 12% y-t-d and has been trading above US$2,300/oz for most of Q2.1 It has also provided double-digit returns across multiple currencies (Table 1).
All this despite high interest rates globally, barring a few exceptions, and a strong US dollar – a combination that is often seen as a hostile environment for gold.
The relationship between gold, real interest rates and the US dollar is not “broken” as some market participants may think. In fact, this relationship has likely prevented gold from rising further. It is simply that, in the current environment, these factors have been offset by others that are more dominant.
So, what has been behind gold’s record-breaking performance to date in 2024? Support has come from continued purchases by central banks, strong Asian investment and resilient global retail consumer demand.
H2: inflection ahead?
The global economy and financial markets are in a transitional period. Bond yields have moved generally sideways as Western central banks have kept policy rates on hold. But pressure is mounting on policymakers as they balance lower but stubborn inflation and signs of cooling labour markets. This is exemplified by the sooner-than expected rate cut by the European Central Bank (ECB), while the Bank of England and US Fed have so far stayed put. Meanwhile, India remains one of the economic bright spots, and China will likely continue to find alternative measures to invigorate growth.
In this context, we analyse how gold may react to current market expectations and explore the drivers that could lead to a different outcome.
A (largely) efficient market
Analysis based on QaurumSM and our Gold Valuation Framework suggests that the gold price today broadly captures consensus expectations for H2 in relation to economic growth, interest rates and inflation (Table 2).
This, in turn, implies that gold may continue to move in a similar range to what we have seen in recent months. In other words, after gaining good momentum in the first half of the year, current market trends indicate a rangebound performance from its current levels during H2.
Table 2: Market consensus suggest rangebound performance for gold for H2
Consensus expectations and select gold drivers*
| Expected Fed funds rate | Current 5.25% - 5.5%; 25bp lower by year end |
| Economic scenario | Restrained recovery |
| Opportunity cost | 10yr: stable, marginally down |
| Dollar: flat to slightly down | |
| Economic expansion | Below trend but improving |
| Risk and uncertainty | Stubborn inflation |
| Risk-on positioning | |
| Geopolitical risks | |
| Momentum | Central bank purchases above trend |
| Commodities down marginally | |
| Gold net positioning is high | |
| Implied gold performance | Rangebound |
Source: Bloomberg, Oxford Economics, World Gold Council
*We group variables that influence gold into four drivers to understand its performance, namely: 1) economic expansion, 2) risk and uncertainty, 3) opportunity cost, and 4) momentum. See QaurumSM and Table 3 for more details.
It’s not the first time we have described a similar anticipated outcome for gold. And, at face value, a sideways move does not seem very exciting. But it encapsulates two important insights.
First, we are naturally using “expected” rather than “observed” values for each of the drivers; in this context, a rangebound return suggests that the gold market is fairly efficient and broadly reflects the available market information.
Second, given that gold is already up by more than 10% and consensus suggests a similar result for the full year, it reiterates that gold – supported by contributions from other sectors – can perform well even when rates remain as expected.
Western investors: wanted
Given the inherent complexity in forecasting economic and financial variables, market consensus may be telling us more about the world today than looking ahead to H2. As such, it is important to understand the conditions that could divert us from the current view.
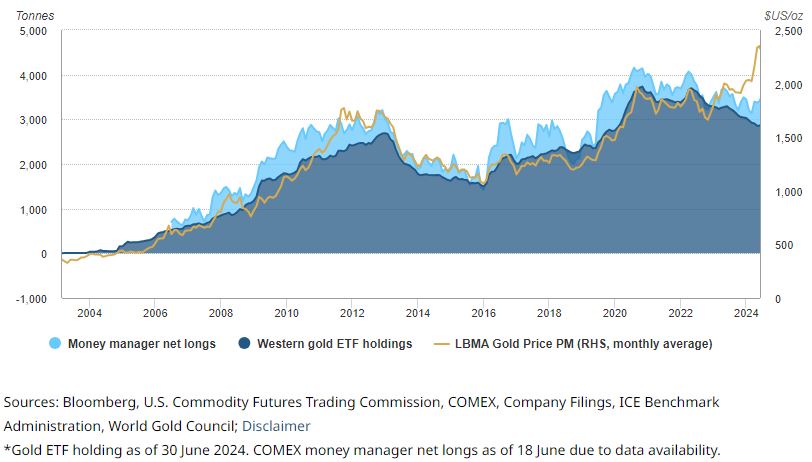
For gold, Western investors have been a missing part of the puzzle. While investors have been active – as denoted by high market volumes – retail investment demand has been low and gold ETFs have seen net outflows y-t-d. Gold’s strong performance, despite the absence of strong Western flows, suggests that, unlike previous periods when gold broke record highs, the market is still not saturated and could see another leg up (Chart 2).
Demand from this segment of the market could be triggered from three key sources: interest rates, recession risks and geopolitics.
Chart 2: Previous gold highs have coincided with strong Western flows suggesting that the gold market is not yet saturated
Physically backed gold ETF holdings and COMEX gold positioning*
Interest rates
Since the rate cut by the ECB in May, European gold ETFs have experienced inflows. A continuation of this trend would provide further support. And while there’s already a 25bp cut by the Fed priced-in by the market for later in the year, the actual policy decision would bring reassurance to investors about the direction of rates going forward, thus fostering sustained inflows. On the flip side, of course, higher-for-longer may deter some gold investors from entering the market.
Recession risks
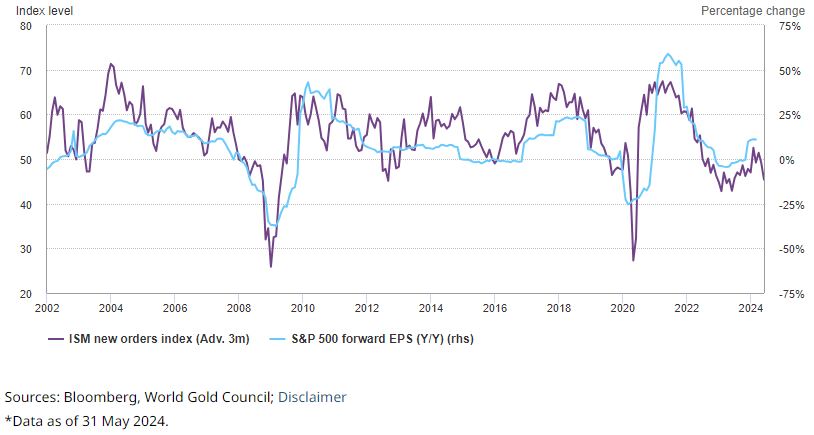
While a recession remains a low probability in the immediate term, the global economy is not firing on all pistons and, with inflation above target, central banks are not ready to cut rates more aggressively just yet. There also seems to be some complacency in financial markets. Global stocks are doing well overall with US stocks – or a subset thereof – leading the pack. And volatility is near 30-year lows. Yet, historically, there’s a strong relationship between the strength of manufacturing and company earnings and, at present, manufacturing is showing signs of slowing (Chart 3).
Chart 3: Earnings may need more than the AI boom to keep up from here
ISM new orders versus S&P 500 forward earnings*
Geopolitics
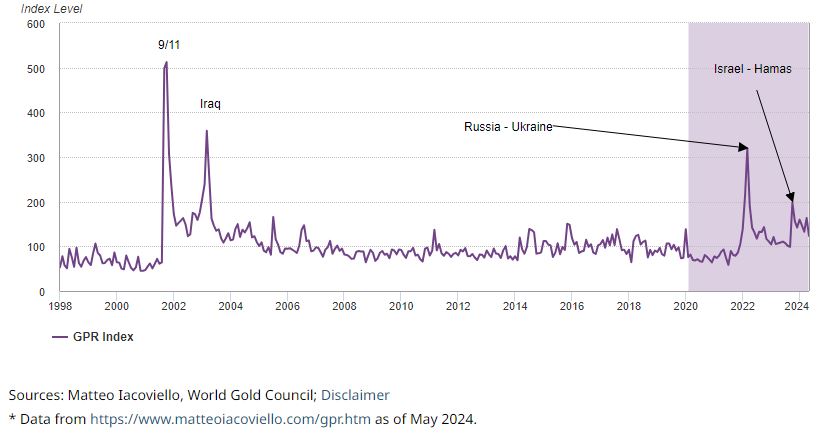
While the current unease could be seen simply as the new normal, geopolitical risk has been on the rise in recent years and is unlikely to abate anytime soon (Chart 4). Political polarisation, armed conflicts and erosion of globalisation in favour of nationalism and select alliances fuel economic instability. Geopolitical risk is particularly difficult to predict and may come from where it’s least expected. What is true, however, is that gold reacts to geopolitics, adding 2.5% for every 100-points the Geopolitical Risk (GPR) Index moves up.2 And while part of this effect can be transient, it could also be a trigger for deteriorating financial conditions, which may have a more lasting effect.
Chart 4: Geopolitical risk has been trending up
Geopolitical Risk Index (GPR)*
Emerging markets: gains and pains
While there’s room for gold to move up, there are also factors that could curtail its strong run. Two stand out: central banks, and Asian investors.
Central banks
Central bank demand has been a key driver of gold’s performance in recent years. We estimate that it contributed at least 10% to gold’s performance in 2023 and potentially around 5% so far this year. However, the People’s Bank of China (PBoC) has reported a deceleration in gold purchases over recent months, culminating in holdings that remained unchanged at the end of May.
This, combined with notable sales, has raised questions as to whether demand from the official sector may lose momentum. But we still expect central bank demand to remain above trend this year, a view that is shared by Metals Focus in their most recent Gold Focus report.3 While reported gross purchases may be lower than last year, gross sales have also decelerated, primarily due to the absence of the hefty Turkish sales we saw in early 2023. Given that central bank demand is often policy driven, timing is difficult to ascertain, but our recent central bank survey provides some reassurance: gold reserves managers believe they will retain their positive outlook towards gold.
Asian investors
Asian investors have also been important contributors to gold’s recent performance. This has been evident through bar and coin demand, gold ETF flows and, anecdotally, in the over-the-counter market.
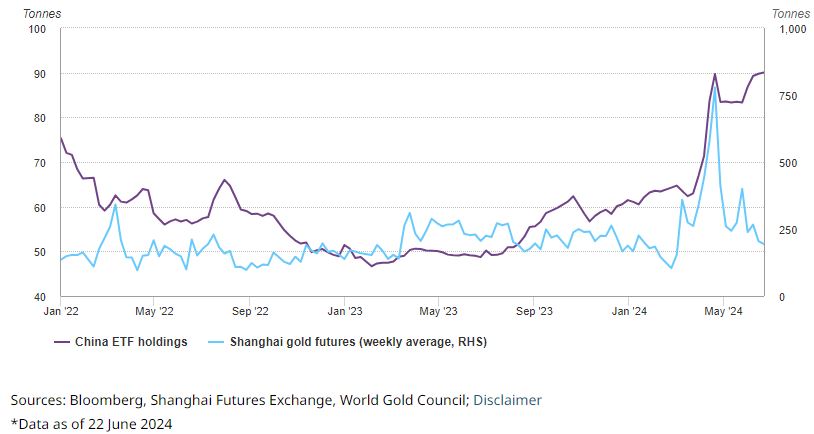
In the past, Asian investors tended to buy on dips, but more recently, they have followed the trend. For example, we have seen meaningful AUM growth in both Indian and Chinese gold ETFs and gold’s move up in early Q2 coincided with a spike in volumes in Shanghai futures (Chart 5). Chinese investor demand was partly supported by positive sentiment linked to central bank buying. So, while the fundamentals of gold ownership remain in place, the question is whether a pause by the PBoC may encourage profit-taking by more tactical investors.
Chart 5: Asian investors have contributed to gold’s strong run
Chinese gold ETF holdings and futures positioning*
Consumers as price makers
It is often posited that consumers tend to be ‘price takers’ rather than ‘price makers’. In the short-term, this may be the case. However, gold jewellery and technology combined make up more than 40% of annual demand. As such, gold consumers play an important role in supporting – and sometimes slowing down – performance. And they usually respond to two key factors: price and income. In this case, the sharp upward trend in the gold price has dampened demand in some markets such as India and China. But positive economic growth can counteract some of this effect. In addition, possible gold price stability can lure back consumers who often respond more negatively to volatility than the level of the gold price. This may be particularly relevant for India, where expectations of economic growth are higher than other regions and gold’s role as a store of value is well cemented.
Connecting the dots
Our analysis showcases gold’s likely reaction to the underlying conditions behind market consensus, as well as alternative hypothetical scenarios (Table 3). While there appear to be many moving parts, Qaurum allows us to paint a clearer picture of these interactions.
In summary, gold may remain rangebound if current market expectations prevail. However, there’s a clear path for gold to outperform from here, likely fuelled by Western flows. Conversely, in the event that central bank demand drops drastically, rates remain high for longer and Asian investor sentiment flips, we could see a pullback in the second half.
Overall, the extent of gold’s reaction upwards or downwards will be a function of the magnitude by which each of the aforementioned factors – or a combination thereof – move.
It is also important to note that each of these scenarios has implications for other asset classes. A robust asset allocation strategy must take into account not just market consensus but alternative views. And in that context, our analysis shows that gold plays a key role as a diversifier and source of liquidity, coupled with its positive long-term returns.
Table 3: Gold’s performance in a given economic scenario is driven by the interaction of its four key drivers
Economic scenarios and factors that impact gold based on key drivers*
| Expected Fed funds rate | Current 5.25% - 5.5%; 25bp lower by year end |
More rate cuts priced in | 5.5% - 6.5% by year end | |||
| Economic scenario | Restrained recovery | Recession risk | Higher-for-longer | |||
| Opportunity cost | 10yr: stable, marginally down Dollar: flat to slightly down | 10yr: lower | 10yr slightly higher | |||
| Dollar: up on safe haven | Dollar up on rates differential | |||||
| Economic expansion | Below trend but improving | Recession risks increase for 2025 | Growth slows down | |||
| Risk and uncertainty | Stubborn inflation | Inflation drops but is above target | Inflation reaccelerates | |||
| Risk-on positioning | Risk-off positioning | Market volatility | ||||
| Geopolitical risks | Geopolitical risks | Geopolitical risks | ||||
| Momentum | Central bank purchases above trend | Central bank purchases above trend | Central bank purchases continue | |||
| but at or slightly below trend | ||||||
| Commodities down marginally | Commodities sell off | Commodities rebound | ||||
| Gold net positioning is high | Gold net positioning increases | Gold net positioning deteriorates | ||||
| Implied gold performance | Rangebound | Additional upside | Downside pressure | |||
| Colour key (effect on gold): | Positive | Neutral | Negative | |||
Source: World Gold Council
*Based on market consensus and other indicators. Size of gold drivers represents relative importance within each scenario. Impact on gold performance based on average annual prices as implied by the Gold Valuation Framework.
1Based on the LBMA Gold Price PM in USD as of 27 June 2024.
2The GPR index by Matteo Iacoviello measures both actual and perceived geopolitical tension. See: Geopolitical Risk (GPR) Index (matteoiacoviello.com)
3Gold Focus 2024, Metals Focus, May 2024.
This article is a re-post from here.
![]() Our free weekly precious metals email brings you weekly news of interest to precious metals investors, plus a comprehensive list of gold and silver buy and sell prices.
Our free weekly precious metals email brings you weekly news of interest to precious metals investors, plus a comprehensive list of gold and silver buy and sell prices.
To subscribe to our weekly precious metals email, enter your email address here. It's free.
Comparative pricing
You can find our independent comparative pricing for bullion, coins, and used 'scrap' in both US dollars and New Zealand dollars which are updated on a daily basis here »
Gold has no dividend, it's dangerous to store at home and is generally uninsurable unless specific arrangements are made.
Compared with stock markets it's been a very poor performer, many countries that own it are third world and current LBMA London Vault Data shows that storage has declined by about 35,000 ounces.
Central banks are deciding it's dangerous not to store it at home.
Nigeria isn’t alone in wanting to control its gold reserves and bring them home. India recently repatriated 100 tons of gold from vaults in the U.K.
Many countries have expressed concern about the U.S. and Western powers using gold and dollar reserves as a foreign policy weapon.
According to a World Gold Council survey in 2023, a “substantial share” of central banks expressed concern about potential sanctions after the U.S. and other Western countries froze almost half of Russia’s $650 billion gold and forex reserves in the wake of its invasion of Ukraine. According to the WGC, 68 percent of the banks surveyed said they plan to keep their gold reserves within their country’s borders. That was up from 50 percent in 2020.
One anonymously quoted central bank official told Reuters, “We did have it [gold] held in London… but now we’ve transferred it back to our country to hold as a safe haven asset and to keep it safe.”
https://www.zerohedge.com/economics/even-nigeria-plans-bring-gold-reserves-home-minimize-risk
Zerohedge...you're not serious? It's a conspiracy website that's been predicting global meltdowns and a USD crash that never happen - for years.
The World Gold Council has one objective in mind...to raise the gold price.
it's dangerous to store at home
More dangerous than storing a house at your home? Pretty sure the gold will survive flood and fire just fine.
Gold gained 4% in Q2, while silver up a whopping 17%.
In Kiwi pesos,
YTD - +17%
Past 12 months - : +23%
Past 5 years: +78%
Past 10 years: +153%
Gold doing what it does.
Indeed.
Gold is the money of kings, silver is the money of gentlemen, barter is the money of peasants – but debt is the money of slaves.
Arguably gold has a comparative SOV in ratty now.
If you wonder about the long-term outlook for bitcoin ETFs, consider the net flows into gold ETFs by year following their US launch.
Gold ETF Flows by Year
2004: $1.5b
2005: $3.3b
2006: $4.8b
2007: $5.6b
2008: $11.2b
2009: $19.3b
We welcome your comments below. If you are not already registered, please register to comment
Remember we welcome robust, respectful and insightful debate. We don't welcome abusive or defamatory comments and will de-register those repeatedly making such comments. Our current comment policy is here.