

The bank economist who said New Zealand was the "rock star economy of 2014", maintains we are firing on all cylinders again.
HSBC chief economist for Australia and New Zealand, Paul Bloxham, says New Zealand is yet again outperforming other economies, with construction and tourism continuing to pick up and the dairy sector recovering.
He says strong growth and rising commodity prices are expected to see CPI inflation edge higher.
However Bloxham admits rapidly rising housing prices and household debt present financial stability risks and will be a key issue in the election.
Here's a report he has done with HSBS economist, Daniel Smith:
We have been optimistic about New Zealand’s economy for quite some time now, and we remain so. Growing ties to Asia, underlying flexibility and a positive reform agenda have all worked in New Zealand’s favour.
Growth has been driven by record rates of inward migration, rising construction activity, and a booming tourism industry. Weighing on this positive story, for the past couple of years, have been weak conditions in the dairy sector. However, milk prices picked up recently and the dairy sector is now recovering. New Zealand’s economy is, once again, firing on all cylinders. Following strong GDP growth of 3.2% in 2016, we expect continued above-trend growth of 3.0% in 2017.
At a deeper level, growth has been underpinned by reforms that were put in place in 2009 and an improving fiscal position. The latest budget estimates showed a second year of fiscal surplus in 2015/16 and that surpluses are set to continue. This is in stark contrast to Australia’s more challenging budget situation. Nonetheless, policymakers have faced challenges. For the RBNZ, CPI inflation has been too low – having been below the RBNZ’s ‘near 2%’ target for five years – which has prompted the central bank to cut the cash rate to a record low level of 1.75%. This has, in turn, motivated a significant rise in house prices and household debt, particularly in Auckland, which presents risks to financial stability and has reduced housing affordability.
Thankfully, the low inflation challenge may be almost over. We expect the combination of continued strong local growth and higher commodity prices to see CPI inflation edge higher in 2017. We expect this to also mean that the RBNZ’s next cash rate move is likely to be up, although our central case does not have hikes until 2018. Having had CPI inflation below target for five years, we think the RBNZ may be quite cautious about lifting rates. Adding to the policy uncertainty, housing affordability is expected to be in focus at this year’s election (which needs to be held before 18 November) and RBNZ Governor Wheeler’s current term is due to end on 25 September.
The construction boom is leading the way
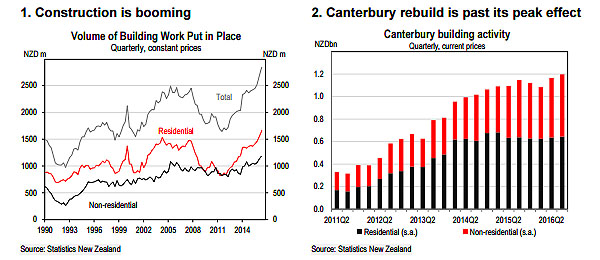
New Zealand’s economy has several pillars supporting growth at the moment, but the strongest is construction (Chart 1). GDP grew by 3.5% over the year to Q3 2016, of which 0.7ppts were contributed by the construction sector – more than any other sector and well ahead of the next biggest contribution of 0.5ppts from professional services.
The rebuild of the Canterbury region, following major earthquakes in 2010 and 2011, has been a key driver of construction activity in recent years. At a total estimated cost of NZD40bn, this is a significant project that will likely span a decade or longer. The residential part of the rebuild drove a lot of the growth from 2012 to 2014, but this activity has since plateaued and residential consent issuance has begun to level out (Chart 2). The commercial and public aspects of the rebuild, which took longer to get going, are still ramping up but are also likely to peak soon. From 2017 onwards the Canterbury rebuild is likely to become a small drag on growth, as we are now past the peak of its impact on the economy.
As the rebuilding activity starts to wane in Canterbury, building work is expected to continue to grow quickly in other parts of the country. In particular, residential construction is ramping up quickly in many regions in response to New Zealand’s strong rate of population growth. This has been centred on Auckland, where around half of new migrants settle. Residential consent issuance in Auckland passed 10,000 in 2016, up from 3,700 in 2011 (Chart 3).
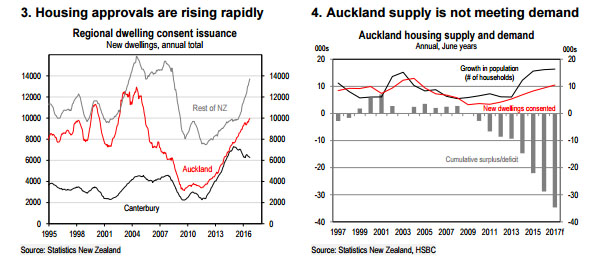
Importantly, despite strong growth in housing construction in Auckland, new building has not kept pace with strong demand due to rapid population growth. On our estimates, Auckland’s current population growth is so strong that we estimate the region would need to add at least 17,000 new dwellings annually just to keep up (Chart 4). There is also an accumulated deficit, resulting from the slow pace of construction in recent years, which we conservatively estimate at around 35,000 dwellings. In our view, there is plenty of scope for building to ramp up much further in Auckland as much more housing is needed.
The road to greater housing supply was opened in 2016 with the approval of the Auckland Unitary Plan, which released new land for development and allows for increased density in many existing areas. The plan aims to deliver over 400,000 new dwellings over the next 25 years, which would increase the existing stock by around 85%. Urban expansion on this scale also requires significant investment in infrastructure to improve transport links and open up new land for development (the Auckland Unitary Plan expands the amount of land within the urban boundary by around 30%). Early work on the NZD2.5bn city rail link has now begun, but significantly more work will be needed over the coming decade.
There has also been a strong pick-up in housing approvals outside of Auckland and Canterbury. This is partly being driven by reduced housing affordability in Auckland, which is encouraging new migrants to settle in other regions.
Tourist numbers continue to climb
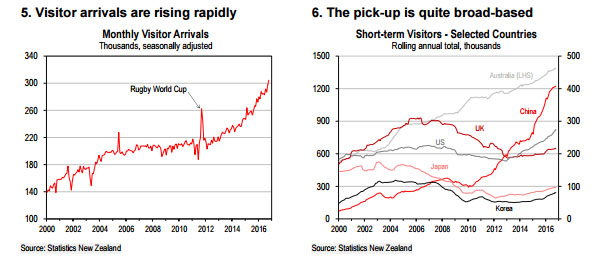
New Zealand’s tourism industry is booming. Short-term visitor numbers rose by 12% over the year to November 2016, which follows annual growth of 10% in 2015 and 5% in 2014 (Chart 5). Arrivals numbers have been largely driven by visitors from Australia (up by 6% y-o-y or 75,000 people) and China (19% y-o-y or by 65,000 people).
The lift in visitor arrivals is, however, quite broad-based. Almost every significant market showed double-digit percentage growth in 2016. Korean arrivals were up 31% and Japanese numbers rose by 15%. The story is not even a purely Asian one – Canadian arrivals were up 13% and US arrivals by 18%, making the American market comfortably the third largest market for visitors.
While the lift in Chinese visitors is, in part, being driven by the structural story of rising incomes, an expanding middle class and greater appetite for international travel, there appear to be other factors at work. New Zealand is also benefitting from the more competitive NZD, lower airfares, and the country’s positive reputation, including for security and safety.
We expect 2017 to be another good year for New Zealand’s tourism industry. The highlight is expected to be the British and Irish Lions rugby union tour during June and July, which should see an influx of visitors from the UK – a traditionally strong market that has experienced fairly lacklustre growth in recent years. The previous Lions tour, in 2005, saw a 14% m-o-m increase in total visitor numbers (from all countries). The post-referendum depreciation in the GBP will reduce the spending power of tourists from the UK, but the tour should still deliver a sizeable boost during the typically quieter winter months.
Strong growth in tourism activity is expected to support a pick-up in investment in hotels and other accommodation facilities, although this has not as yet arrived. Occupancy rates have been rising quickly in most regions and are particularly high in Auckland. In Auckland, hotel occupancy rates are at record highs and still climbing, and yet overall accommodation capacity has actually been falling in recent years (Chart 7).
However, there are signs that this is beginning to create the financial incentives for investment in new capacity. A report commissioned by the government in 2016 found that only one new hotel had been completed in Auckland since 2011, but that five were currently under construction and another seven projects were under consideration (‘Regional Hotel Market Analysis and Forecasting’, New Zealand Trade and Enterprise, May 2016). Nonetheless, the expansion in hotel capacity over the next decade was only projected to be around 60% of that needed to keep up with expected demand growth.
Building consents for short-term accommodation have picked up, led by Auckland and Canterbury, where the non-residential aspect of the post-earthquake rebuild is still accelerating (Chart 8).
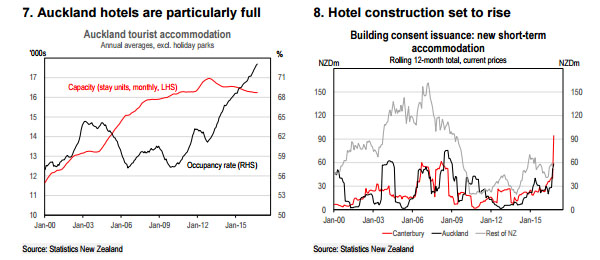
Over the next few quarters this is likely to result in additional building activity – placing yet more pressure on the construction sector – with plenty of scope for more accommodation capacity to be added over coming years.
Dairy prices rise, but production is weaker
The dairy sector has been through two challenging years in which the farm gate milk price was below the cost of production for most farms. Fortunately, the sector was in good financial shape following the strong 2013/14 season, when output and prices were at record highs.
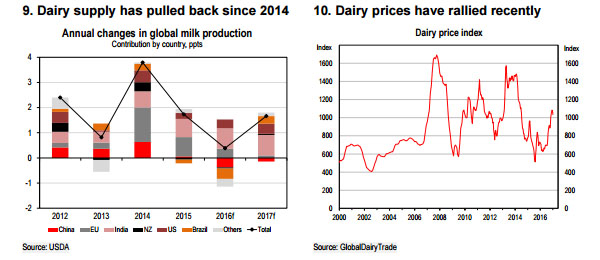
The key driver of the low price levels over 2014, 2015 and into 2016 had been a significant boost to global supply (Chart 9). This reflected strong supply from New Zealand, as earlier high prices had motivated investment, and the removal of EU production quotas in early 2015. This led to a 6% rise in global milk production between 2013 and 2015.
Likewise, the recent increase in dairy prices has reflected a pull-back in supply. This took some time to occur, with the cutback in New Zealand’s supply only starting in early 2015, nearly a year after prices had begun to fall. In the EU (the other major exporter of dairy), it was not until 2016 that serious efforts were made to restrict output, when farmers were offered subsidies to limit production. In China, low domestic prices also forced many smaller producers out of the industry. In total, global milk production grew by just 0.4% in 2016, according to the USDA.
Limited supply growth has aided a rebound in dairy prices, which rose by 55% during the second half of 2016 (Chart 10). In New Zealand, on top of voluntary cutbacks, wet spring weather dented production in October 2016, which is the peak period of the season. So far, with data collected for the first six months of the 2016/17 season, output is running 3.6% behind the previous season. That means 2016/17 output is on track to be the lowest in five years.
The economic implications of this are varied. In nominal terms, farming incomes are set to rise substantially, which should provide a boost to retail sales in rural areas and possibly to on-farm investment; many farmers will have delayed maintenance and investment during the past couple of years.
However, for real GDP it is export volumes (not values) that matter and those are likely to remain a drag on growth over coming quarters. However, this is still a good news story. A return to profitability in the dairy sector removes a key downside risk to growth: bankruptcies, mortgagee sales of farmland and a fall in land values.
Rising house prices pose risks and reduce affordability
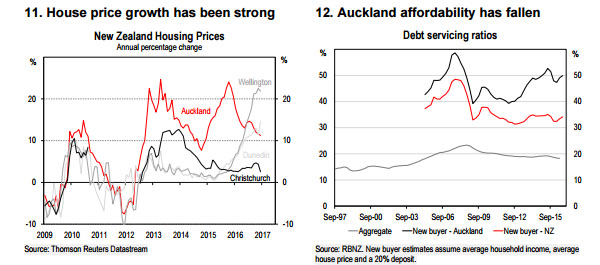
New Zealand has seen a significant housing price boom in recent years (Chart 11). Over the past five years, Auckland house prices have risen by around 110%. The strong pace of house price growth has also spread beyond Auckland over the past year or so. From 2012 to late 2015, strong house price increases were largely confined to Auckland (aside from some price increases in Christchurch following the 2011 earthquake’s impact on reducing housing supply). Strong housing price growth outside of Auckland appears to reflect catch-up, as reduced affordability in the Auckland housing market has made it comparatively attractive to buy housing in other regions (Chart 12).
The catch-up in housing price growth in other regions could also reflect region-specific macroprudential policies adopted by the central bank. Given concerns about over-exuberance in the housing market, the RBNZ has, in several stages beginning in late 2013, implemented macroprudential restrictions in an effort to cool the housing market. In terms of house price inflation, the RBNZ’s tighter macro-prudential settings have had only small and temporary effects, although they have reduced the amount of higher risk lending in the system. However, risks are still present, given the speed at which house prices have risen, particularly in the Auckland region.
House prices and debt levels have risen rapidly
The Auckland housing price boom began in 2012 and by mid-2013 the RBNZ was sufficiently concerned by the pace of house price inflation and the prevalence of high loan-to-value ratio (LVR) mortgages that it began to tighten the macro-prudential settings. At first, it introduced a ‘speed limit’ of 10% of new lending that was allowed to have a LVR of over 80%. Since that initial measure was introduced in late 2013, Auckland house prices have risen by 58% and, nationally, overall household credit has risen by 24%.
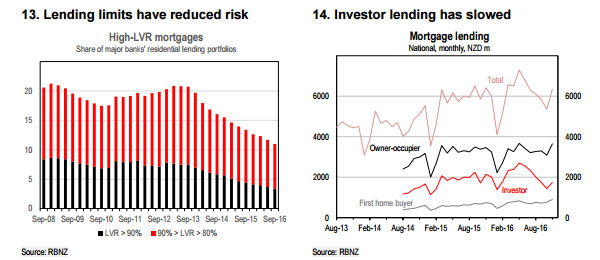
A result of the measure was a significant reduction in the amount of high LVR lending. Before the restrictions were imposed, around 30% of new mortgages had LVRs above 80% (that is, the borrower had a deposit of less than 20% of the value of the property), but this fell to around 6-8% of new lending following the introduction of the new rules (Chart 13). The banking system is less vulnerable to a drop in house prices than it would otherwise be as a result of these measures.
The next worrying trend to emerge in the housing market (again, centred on Auckland) was the growing prominence of investors. The proportion of new mortgage lending to investors rose steadily from 29% in late 2014 to a peak of 38% in mid-2016 (Chart 14). This was despite tighter LVR restrictions being introduced for investors in the Auckland market in late 2015. The increasing prominence of investors in the housing market has been worrying for a number of reasons. Increased investor activity suggests rising speculative behaviour. Investors may also be more likely than owner-occupiers to exit the market in the event of a downturn, which could exacerbate the cycle.
There is also some worrying evidence about the exposure some investors are building up. RBNZ data suggests that, as of mid-2016, around a quarter of all property purchases in Auckland were made by investors who owned at least three properties (and around 15% were made by those owning at least five properties). This suggests a situation in which higher prices generate paper gains in wealth, which are being leveraged up by investors to fund the next property purchase.
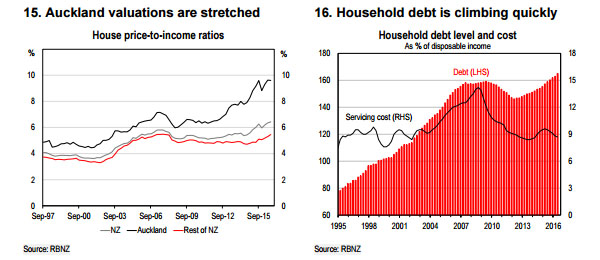
Despite the recent run-up in national house prices, housing valuations outside of Auckland do not look extreme relative to incomes (Chart 15).
Within Auckland though, the scale of the lift in prices since 2012 has pushed the region’s average price to nearly 10 times the average household income. In the previous cycle, before the financial crisis, the house price-to-income ratio peaked at 7 times. Purely from a valuation perspective, this is concerning. Household debt levels have also climbed to record levels (Chart 16).
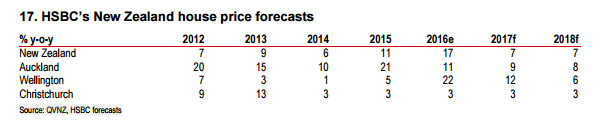
We are forecasting national house price growth to slow from 17% in 2016 to an annual rate of 7% in 2017 and 2018 (Table 17). The slowdown is expected to be driven by range of factors. First, we expect that mortgage rates are unlikely to fall further. We see the RBNZ on hold in 2017 and starting to lift its cash rate in 2018. Second, prudential settings are expected to remain tight. Third, we expect some pull-back in foreign demand as the RMB edges lower, making New Zealand housing more expensive for Chinese buyers, and the Chinese authorities tighten up settings on foreign capital outflows.
Although we expect housing price growth to slow, we still see solid price growth in 2017 and 2018, given that new building is not expected to keep up with continued strong population growth, particularly in Auckland (see Chapter 1 above).
Housing affordability and the election
Housing affordability is expected to be a key issue at this year’s general election (due before 18 November), just as it was at the last election. During the 2014 election campaign, the opposition Labour party was proposing a capital gains tax and greater direct government intervention to boost housing supply. The possibility of changes to the taxation of property would be expected to have a dampening effect on housing market activity.
However, from a policy perspective, the key measure that is likely to be most effective in materially improving housing affordability is an increase in housing supply. The Auckland Unitary Plan should achieve this over time (as we discussed in the first chapter, above); however, given the current rates of construction and the existing undersupply, it will take many years just to bring the Auckland market back into balance.
For the RBNZ, some of the financial stability risks have been mitigated by the macro-prudential measures already put in place. However, household debt has still been rising very quickly, leaving households exposed to the risk of higher interest rates in future. The possibility of imposing some form of debt-to-income cap on new mortgages has been raised as a possible next step.
Inflation may be past its trough
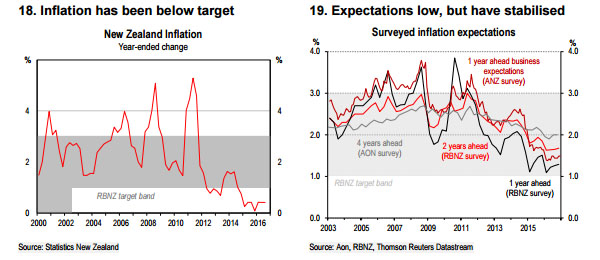
Despite strong economic growth in New Zealand over the past three years or so, CPI inflation has been consistently below target. The last time annual CPI inflation was at or above the RBNZ’s ‘near 2%’ medium-term target was in Q3 2011. Inflation has also been below the 1-3% target band since Q3 2014 (Chart 18). Of greater concern to the RBNZ has been that this extended period of low inflation has also weighed on measures of inflation expectations, which increases the risk of low inflation becoming embedded (Chart 19).
As we have written before, a key reason why inflation has remained low, despite strong economic growth in recent years, has been that the economy’s supply potential has also been growing strongly (see New Zealand Economics: A challenge for the 25-yr old inflation targeting regime, 21 January 2016). The main driver of this has been record levels of net inward migration, which have boosted the supply of available workers. As a result, wage pressures have remained well-contained, as strong labour demand has been met by ample labour supply.
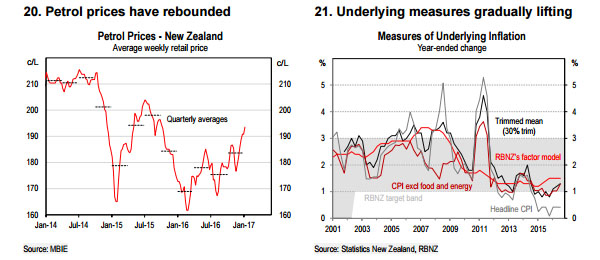
However, we expect that the low point for inflation has now been passed and that CPI inflation should actually lift quite quickly over coming quarters. The major driver will be the fading drag from petrol prices. The previous decline in petrol prices is expected to drop out of the annual CPI inflation calculation and, in early 2017, petrol prices are likely to be a positive factor for CPI inflation in y-o-y terms (Chart 20). We expect annual CPI inflation will jump from 0.4% y-o-y in Q3 2016 to 1.2% y-o-y in the Q4 2016 release (due out on 26 January 2017).
For the RBNZ, it is expected to be a relief to have CPI inflation back within the 1-3% target band, especially if it helps support slightly higher inflation expectations. However, the central bank’s main goal is “keeping future average inflation near the 2% target mid-point.” In practical terms, this means keeping underlying inflation near 2%.
Over the past few years, most measures of underlying inflation have been higher than the headline inflation numbers, because they generally strip out the impact of petrol prices (Chart 21). Nonetheless, they have still been fairly weak, with most of them tracking around the bottom of the target band. The underlying measures will not benefit from the positive base effects of petrol prices, and so are unlikely to experience the rebound expected to be seen in headline inflation over the next few quarters. More positively, though, most measures of underlying inflation did lift a little over 2016, suggesting that domestic price pressures are gradually building.
Construction sector is showing signs of stretched capacity
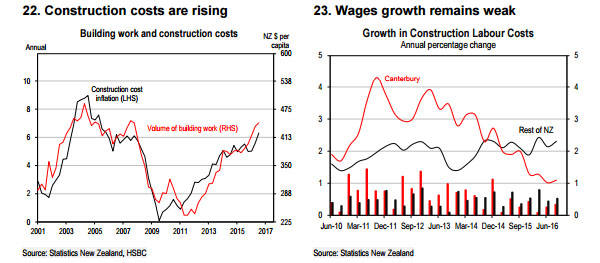
For underlying, domestically generated inflation pressures to rise, spare capacity will have to be reduced. There is already some evidence that this is happening, particularly in the construction sector. Perhaps unsurprisingly, given the growth in activity in this sector, there are signs that capacity is becoming stretched and cost pressures are rising. The cost of new housing (excluding the land value), as measured in the CPI, rose by 6.3% over the year to Q3 2016, up from 4.8% two years ago (Chart 22). As construction activity continues to ramp up, the pace of cost growth is also likely to accelerate.
The next signpost we will be looking for is a pick-up in wage growth within the construction sector. So far the numbers suggest that this has not happened; labour cost growth within the sector (excluding Canterbury) has been tracking fairly steadily at just above 2% for the past couple of years (Chart 23). Within Canterbury, where there was a strong increase in labour costs post-earthquake, the pace of wages growth has slowed to around 1% a year.
We expect price pressures to gradually build
Although construction cost inflation is picking up and will likely accelerate further, for a meaningful lift in overall inflation to occur the pressures will need to spill over or spread to other parts of the economy. Whether and how quickly this happens is a key uncertainty for 2017, especially when assessing the RBNZ’s appetite to start lifting interest rates.
We expect that, given the long period of low inflation, the RBNZ is likely to be cautious and will probably prefer to respond too slowly than to choke off the early stages of a lift in inflation. However, there is always a possibility, given the strength of the economy, that inflation lifts more quickly, which would most likely result in early or more aggressive rate hikes than we are currently assuming.
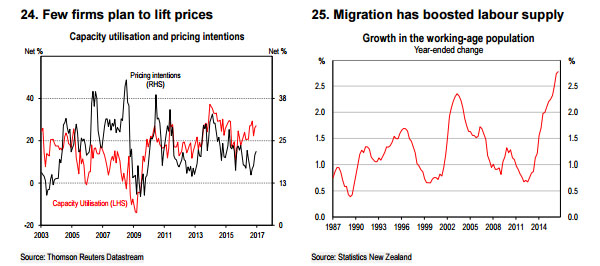
At the moment, though, there is little evidence of this latter scenario. Business surveys show that, although overall capacity utilisation is relatively high, the proportion of firms intending to lift prices remains low (Chart 24). Capacity utilisation has been high through much of the recent low inflation period, so we would place more emphasis on pricing intentions. Inflation expectations also remain low.
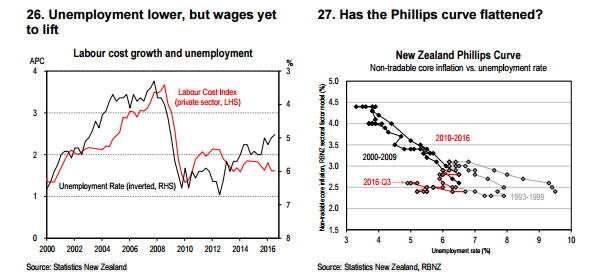
As always, the labour market will be key to the inflation outlook; to get a sustained lift in inflation, higher wage growth is probably necessary. The pace of decline in the unemployment rate has been slow, because strong net migration has boosted the supply of workers (Chart 25). However, there seems to be another effect at work as well. With the decline in the unemployment rate that we have seen, however gradual, historical relationships suggest that wage growth and domestically generated inflation should be running quite a bit stronger than currently (Charts 26 and 27). The so-called Phillips curve appears to have flattened.
Why this has happened and how persistent it will prove to be are unclear. In part, it may be a ‘hangover’ from the Global Financial Crisis; workers may be more concerned with job security than with wage increases as the financial crisis increased their uncertainty about the future. It may also be linked to low CPI outturns, as many contracts are linked to the actual rate of CPI inflation. It is also clear that New Zealand is not alone in experiencing this shift in the relationship between the unemployment rate, wage growth and inflation; a similar phenomenon has been seen in Australia, the UK and the US in recent years.
The RBNZ’s challenge
Our central case sees CPI inflation lifting back into the target band in the Q4 2016 release, and then gradually edging towards 2% over 2017. There is potential for petrol prices to push CPI inflation higher than that, although the effect would be temporary and unlikely to have much impact on the underlying measures of inflation.
Under different circumstances, it may be easy to see the RBNZ lifting rates quite quickly; if inflation is approaching the medium-term target and interest rates are well below most estimates of neutral, then lifting rates to a less stimulatory level would seem appropriate.
However, this was exactly the reasoning that saw the RBNZ lift the cash rate by 100bps in 2014, only to see inflation drop below 1%, forcing a course correction and 175bps of rate cuts. Given this recent experience, we expect that the RBNZ is likely to be cautious in raising rates. The central bank may be prepared to overshoot the 2% target for a time to lift inflation expectations.
Another element that may affect the central bank’s reaction function is that the current five-year term of Governor Graeme Wheeler ends on 25 September 2017. If he seeks a second term, his reappointment would be up to the Minister of Finance. A general election must also be held before 18 November 2017. The role of the RBNZ and monetary policy in New Zealand may well be a topic of debate in the lead-up to the election, as it was in the 2014 election.
All of this will take second place to the fundamentals of growth and inflation in the RBNZ’s decision making. However, at the margin, these uncertainties could lead to more stable (or less active) monetary policy than would otherwise be the case.
26 Comments
GDP 'growth' is set to boom again isn't it? After all, we've just received the bonus of the Kaikoura earthquake and its assorted 'benefits' to build on.....
Paul Bloxam; who got one call on interest rates right many years back, and has lived on it ever since. Pretty much as our 'Phil Rudd' economy has done....
HSBC. Thnaks for your commentary. Heres mine -
"Since 2012, HSBC has been involved in arranging loans and other credit facilities totalling US$16.3bn for the six companies profiled in Greenpeace’s Dirty Bankers report, as well as nearly US$2bn in corporate bonds"
http://asiapacificreport.nz/2017/01/17/hsbc-accused-of-being-dirty-bank…
Income to housing ratio approaching 6:1 is "not extreme", out of touch much.
Rock star economy? Productivity growth is as anemic as ever. GDP per capita flat. More like one hit wonder. Inflated assets do not make for growth...
In Roman times BC House prices were rising so what is new here? There was no room at the Inn?
Look how that worked out for the Romans !
I see a bit of the beginning of the end, vacant retail space has been a pretty good indicator in the past, there seems to be an increase in space visually in my neighbourhood. The huge amount of apartments/terraced houses going up just around my morning walk (glut coming up in 18 months), the real estate agent that had sold on every house in its window on the corner of Bond and Great North rd, now only has one sold sticker.
Anecdotally my customers (retailers) particularly in Auckland are not doing well. Personally I think the spendathon has slowed markedly.
I can confirm that Auckland hotel prices are damn expensive at the moment.
Historically when unemployed drops to the low point is is usually just prior to a financial crisis. It could just be a coincidence (or not).
I thought Rockstar economy had died as everything going on with these statistics usually conceals problems. The household debt figures still aren't updated but record debt combined with rising interest rates will probably create a problem in 2-3 years as the debt servicing costs start biting. That and rising debt with pay staying flat isn't a good mix.
Bloxham would never write for Rolling Stone, especially when they have people like Matt Taibbi. He inadvertently shows you something interesting though: how house price inflation expectations are divorced from inflation expectations such as the CPI (7% house price inflation predicted nationwide over the next two years while the CPI "edging" towards 2% in 2017). I don't care what Bloxham or HSBC thinks or where they have been schooled in economic thought: 7% inflation in house prices is Muslim-terrorist-in-heaven-with-virgins for most NZers when the general price level is expected to be relatively benign.
House price increases of that order are as addictive as P to NZers. Then mix that with leverage and speculation. What could possibly go wrong?
"7% inflation in house prices is Muslim-terrorist-in-heaven-with-virgins for most NZers"
That is the best comment I have seen here for some time, GBH had better lift his game.
Hey Scarfie
Bad enough with one (near as anyway) virgin telling me what to do, how to drive etc let alone 72 of em !!!
Yeah the "rock star' economy that can't afford a bowel scanning programme, cant fund health sufficiently, so that 10,000 are not waiting for hernia ops. , cant afford to clean up its polluted water ways, can't fund . St John, The fire service or coast guard.
We cannot afford to earthquake strengthen the buildings in our main cities, let alone provincial towns, the list is extensive, yet average NZers are subjected to listening to the ongoing BS about how great we are .
As someone else said , we've become the worlds best at claiming were the worlds best.
Don't forget the unchanged Police budget that means they have to do more with less.
no, no, no
cities of sails
courtesy of our government :-
we sail close to the wind, and
we sail by the seat of our pants, and
too often find ourselves sailing up creeks without paddles
and
we dodge a bullet every day
NZ is hardly perfect but as a Country to live it is far more appealing than most others. The consequence will be more wealthy money will be drawn into the the country and people will be prepared to pay a premium for it.
Some people are stuck in a time warp.
Kind of crazy that so many NZ-born citizens as a proportion of population are out of NZ (only Ireland is greater). I guess it's the case of the grass is always greener.
It's good to go overseas for experience however I suspect many have been surprised by the pace of change in the world especially those who have been caught out by BREXIT.
or they have been done over by the baby boomers and now to buy that house, pay off the debt the choice is only one way, leave for better wages and prospects .
...and some are short sighted, blinkered and quite stupid.
Great that the wealthy want to move to NZ, this will benefit some individuals who sell their property to them, but how does it benefit the society?
It doesn't, as they generally have already made their money and come to NZ as a haven, not somewhere they are creating businesses, other than a very few of them. They push land prices up, forcing locals out and marginalizing people who can no longer afford to buy, this is about the only effect that any "trickle down" has. They do not participate in local community, thus contributing little to them. Shania Twain was an exception and did seem to mix with locals in Wanaka, but I don't think she comes here any more, I think her ex got the property here.
Oh and of course, they will erect dirty great obstacles so that ordinary kiwis cannot get in, in a sort of reverse Trump move.
Let not forget most of these stats were gathered prior to Mr. Trumps election.... and the question is "Have they included any post Trump impacts into these charts"? such as the rising yield?? which has forced our banks to push up interest rates at least 3 times, which was not considered prior to mr trumps elections?
The tourist boom is as temporary as cheap airline fuel.
The building boom is due to high immigration.
The productivity boom ?? There isn't one.
Our enlarged population has to be supported by the productivity that hasn't grown. That means we got poorer.
National government said we need over 100 billion dollars of new infrastructure to support the enlarged population. That means we have to borrow the loot.
100 billion $, divided by 1 million taxpayers equals $100,000.00 each.
Welcome to poverty young NZ'ers. We sucked your future dry.
The Building boom is driving our economy that is great isnt it? Employment of our young people is up all because of house of prices rising and the need for more houses.
We welcome your comments below. If you are not already registered, please register to comment
Remember we welcome robust, respectful and insightful debate. We don't welcome abusive or defamatory comments and will de-register those repeatedly making such comments. Our current comment policy is here.