

Latest monthly jobs data shows further signs that the rate of unemployment may be close to peaking - or may already have peaked.
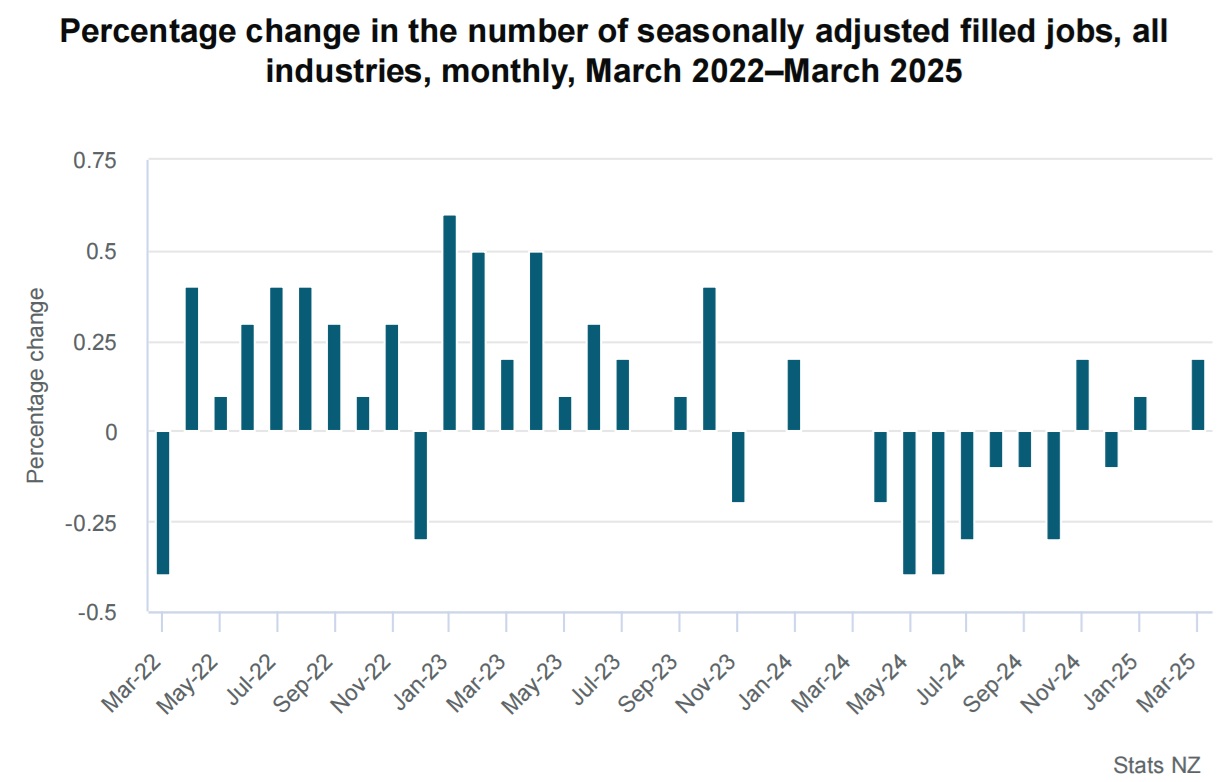
The number of filled jobs in New Zealand rose by over 3500 on a seasonally adjusted basis in March - a 0.2% gain - according to the latest figures from Statistics NZs Monthly Employment Indicators (MEI).
Significantly, for the first three months of this year, the figures have been, in order, a 0.1% rise, flat, and now a 0.2% rise.
It means the figures haven't actually fallen so far this year, with the last recorded drop being 0.1% in December, which followed a 0.2% rise in November. And that November rise had broken a sequence of seven consecutive months of falls last year.
So, while these latest figures don't show a labour market absolutely bubbling, the signs are it is beginning to recover as the lower interest rates in place since the latter part of last year start to have an impact in the economy.
ASB senior economist Mark Smith said the increases "were welcome in an economy looking for good news stories".
However, he noted that the March gains were from a low base.
"We expect hiring to remain patchy over much of 2025, with firms likely to remain gun shy on expansion plans given the uncertain environment," he said.
Recovering base economic momentum later in 2025 should see a pick-up in hiring and then see the unemployment rate recede before year end, Smith said.
The official unemployment figures for the March quarter as measured by Stats NZ's Household Labour Force Survey are due to be released next week on May 7. The Reserve Bank's most recent forecast is that the unemployment rate will have lifted to 5.2% from the 5.1% it hit in the December quarter. The unemployment rate was just 4.0% at the start of last year.
However, the RBNZ was forecasting 5.2% to be the peak - and the latest MEI figures offer encouragement for such a view.
The MEI figures are not directly comparable as they are sourced quite differently - coming from Inland Revenue data - but they have tended to be quite a good indicator of future trends.
The only cautionary tone that should be applied to the latest data is that the figures in this series tend to get revised down in subsequent months. However, the flat reading that was originally reported for February was unchanged in the latest release and it's unlikely a gain of 0.2% would be revised away.
Stats NZ said changes in the seasonally adjusted filled jobs for the March 2025 month (compared with the February 2025 month) were:
- all industries – up 0.2% (3,548 jobs) to 2.36 million filled jobs
- primary industries – up 0.4% (462 jobs)
- goods-producing industries – up 0.1% (453 jobs)
- service industries – up 0.2% (2,762 jobs).
Looking at actual figures when compared with the same month a year ago demonstrates how tough the jobs market has been through 2024.
In March 2025 compared with the same month a year ago actual filled jobs nationally were 2.37 million, down 34,542 (1.4%).
By industry, the largest changes in the number of filled jobs compared with March 2024 were in:
- construction – down 6.1% (12,606 jobs)
- administrative and support services – down 5.7% (6,284 jobs)
- professional, scientific, and technical services – down 3.1% (5,887 jobs)
- manufacturing – down 2.2% (5,198 jobs)
- health care and social assistance – up 1.7% (4,800 jobs).
The figures show that the younger age groups took the brunt of the reductions.
By age group, the largest changes in the number of filled jobs compared with March 2024 were in:
- 15–19 years – down 10.0% (13,567 jobs)
- 25–29 years – down 4.5% (11,881 jobs)
- 20–24 years – down 3.6% (8,383 jobs)
- 30–34 years – down 2.9% (8,773 jobs)
- 35–39 years – up 2.2% (6,053 jobs).
1 Comments
Look at that graph. There's a long way to go before those negatives from March 24 onwards are made up for by positives, so that we are where we were 2 years ago. Basically it appears than in 2 years time, we will be where we were 2 years ago... as long as there aren't any major problems (which there definitely will be).
And look at how disproportionally effected young people are. People are having an argument on another page about how young people do or don't have issues outside/inside their control. Most young people I know can't get a job at all or are competing for poor service jobs not paying a living wage... so they have to stay at home with mum and dad or work 2-4 jobs. Apparently some believe this is not a problem and they should just pull themselves up by their bootstraps somehow. Ridiculous.
We welcome your comments below. If you are not already registered, please register to comment
Remember we welcome robust, respectful and insightful debate. We don't welcome abusive or defamatory comments and will de-register those repeatedly making such comments. Our current comment policy is here.