

Summary of key points: -
- RBNZ claim victory on inflation – it appears premature
- Australian and Japanese interest rate differentials to the USD close-up
RBNZ claim victory on inflation – it appears premature
Reserve Bank of New Zealand (“RBNZ”) Governor, Adrian Orr took a fair amount of flak from journalists in the post-statement media conference last Wednesday and from Government MP’s in the select committee the following day.
The pointed questions were about back-flips and 180- degree U-turns from the 22 May Monetary Policy Statement to the 14 August statement on the economic outlook, inflation forecasts and the timing of interest rate cuts. However, the criticism of the RBNZ and whether they got it right or wrong, does not really mean anything of any significance on a go-forward basis. We did not expect the RBNZ to cut rates so early before the Fed cut their interest rates in the US next month, however the sharp deterioration of the New Zealand economy over recent months determined that the RBNZ could move earlier. The local interest rate market had a 0.25% cut 80% priced-in to the forward curve before the statement, so descriptions of a “surprise” cut were not that accurate. The NZD/USD FX market was at a more balanced 50/50 pricing before the decision, therefore there was some immediate NZ dollar selling, depreciating the Kiwi from 0.6080 to a low of 0.5980. Previous “Orr specials” of wrong-footing the financial markets have sent the Kiwi dollar one cent lower, however the short-term/knee-jerk reactive selling is generally not long lasting, and the NZD/USD exchange rate more often than not returns to the pre-RBNZ statement level within a week. By the FX market close on Friday 16th August, the Kiwi dollar was already trading back up to 0.6060 on a weaker USD.
An examination of the 57-page RBNZ Monetary Policy Statement reveals some interesting insights into how their economic forecasting teams sees inflation travelling over the next 12 months. Important aspects of inflation control and the causes of inflation, however, were curiously absent from the statement.
Two reasons were cited by the RBNZ that forced them to decrease their inflation forecasts for 2024 and 2025 compared to their 22 May statement, wherein they expressed grave concern about high/sticky non-tradable inflation not allowing interest rate cuts until August 2025: -
- Tradable inflation (prices subject to international competition i.e. largely imported goods) now forecasted to decrease to -2.00% on an annual basis due lower oil/commodity prices and lower product prices out of China.
- Non-tradable/domestic inflation decreasing a lot faster in 2024 than earlier forecast, due to additional spare capacity in the economy and price-setters not increasing their prices as much as overall inflation is lower. The latter factor seemingly based on “modelled” inputs and outcomes and a rapidly falling inflation environment.
Very surprisingly, the type of inflation analysis you would have expected from the RBNZ in this latest statement, following their 22 May statement, was strangely missing: -
- Firstly, what are the factors that cause non-tradable inflation to remain sticky/high despite the economy contracting more than expected. As we have repeatedly highlighted in this column on previous occasions, price setting behaviour by the public sector and non-competitive industries in New Zealand has proven to be totally independent and impervious to GDP/economic performance and interest rates. The RBNZ are telling us that their econometric model points to sharply lower non-tradable inflation over coming months, whereas history tells us that the non-tradable price-setting behaviour is immune to any external inflation and economic trends.
- The most important factor that reduces inflation and controls inflation at low levels is free and aggressive competition in the economy that allows consumers a choice for the lowest price. Unbelievably, the word “competition” is not mentioned once in the RBNZ’s statement. It is the lack of competition that causes our troublesome high non-tradable/domestic inflation. No-one is addressing this problem and the RBNZ after being so worried about it in their 22 May statement, completely ignored it last week!
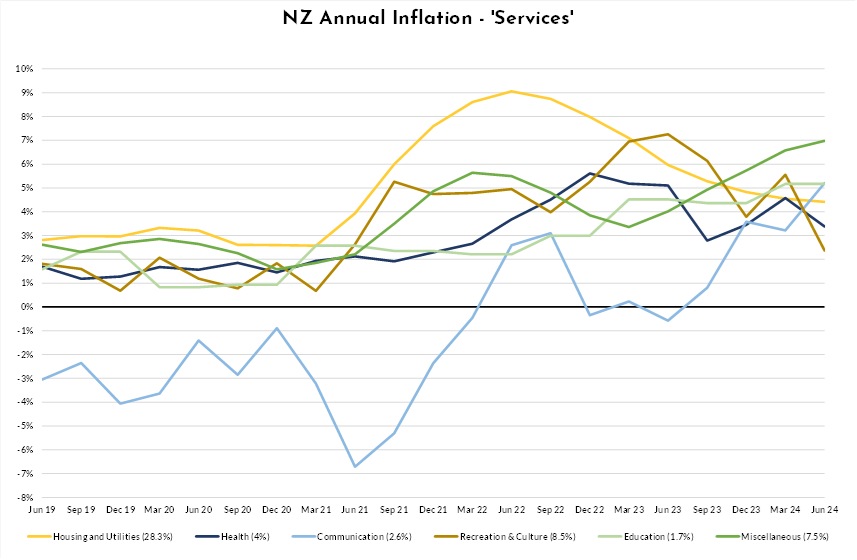
What you do not find in the RBNZ’s statement is analysis of the component parts of the problematic high non-tradable inflation. As the chart below confirms, very few of the services component sub-categories are trending downwards. Outrageous local government rates increases and higher electricity prices in the upcoming September quarter will maintain non-tradable/services inflation at elevated levels for a while yet, despite the RBNZ confidently predicting sharp decreases over coming months.
Many factors determine the trend and level of tradable inflation in New Zealand. The most important being the NZD/USD exchange rate influence over imported product costs, oil prices, commodity prices and whether Chinese manufacturers are increasing or decreasing their USD prices on the products we import from them.
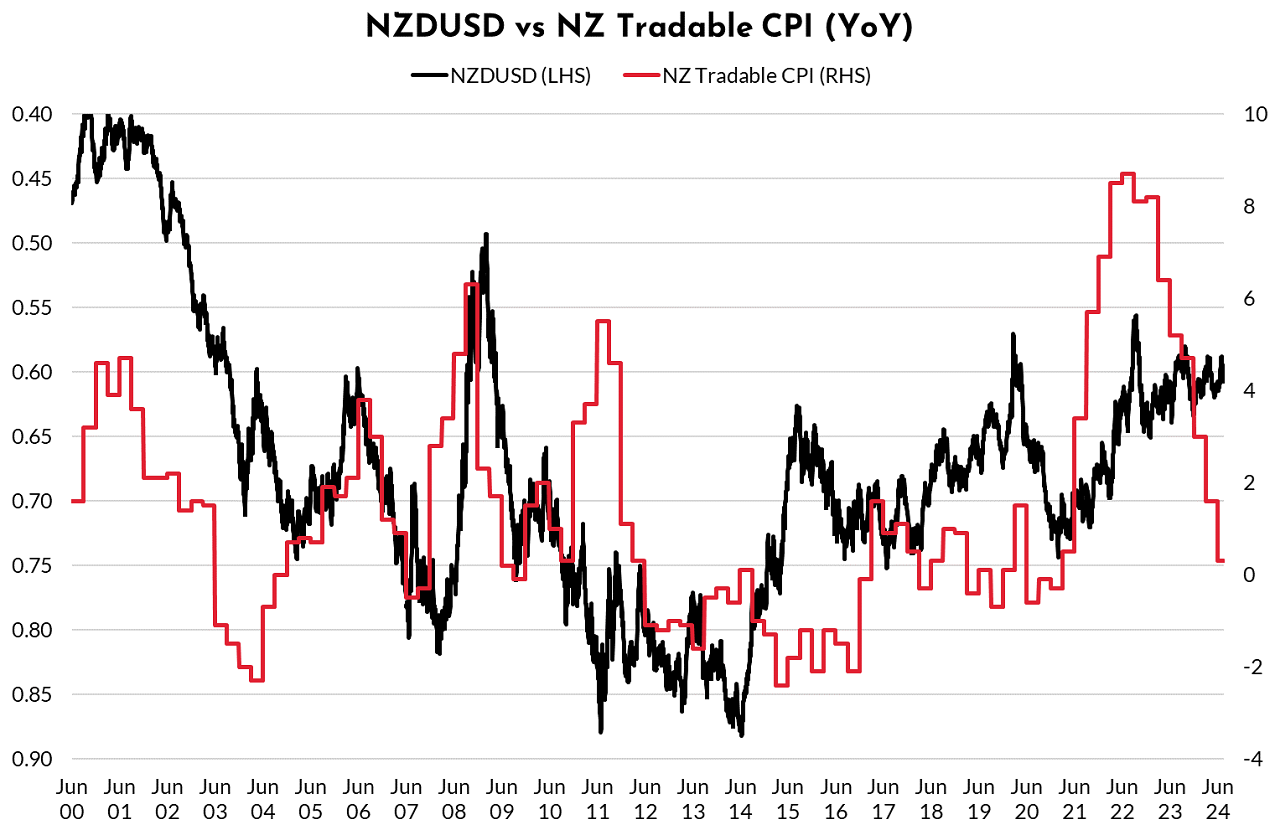
The chart below plots the NZD/USD exchange rate against our tradable inflation rate over the last 25 years. The NZD/USD exchange rate is inverted on the left-hand axis. Unsurprisingly, for an economy with very high import penetration levels, there is a direct relationship and correlation between the level/direction of the Kiwi dollar currency value against the annual percentage movement in tradable inflation. When the NZ dollar depreciates, tradable inflation increases on higher imported costs (2009 and 2022). Conversely, when the NZ dollar appreciates to 0.8500 (2011/2014) and 0.7500 (2021) tradable inflation decreases. The massive increase in tradable inflation to 8.00% in 2022 was compounded by Covid related shipping/freight problems, goods shortages and strong consumer demand stoked by low interest rates and cheap RBNZ money for the bank lenders.
The rapid reversal in tradable inflation from 8.00% 15 months ago to 0.00% today has been caused by the unwinding of those earlier increases, lower USD prices from Chinese manufacturers and weaker consumer demand. However, the steep decrease in tradable inflation has not been driven by a higher NZ dollar value, which has range traded above and below 0.6000 for the last two years. The sharp decline in the annual tradable inflation rate is also a function of monthly price increases in 2024 being significantly below the monthly increases 12 months ago, which drop out of the annual calculation.
It is difficult to see tradable inflation continuing to decline to the -2.00% level the RBNZ are forecasting without significant NZ dollar appreciation. The last time we had -2.00% tradable inflation the NZD/USD exchange rate was above 0.8000 in the 2011 to 2014 period. Should the exchange rate remain in the low 0.6000’s over coming months, tradable inflation is more likely to remain at 0.00%.
The analysis provided here raises many questions about the new RBNZ forecasts of lower tradable and non-tradable inflation over coming months they seem so confident about. If inflation does not reduce as far, or as quickly, as the RBNZ forecast, forward interest rate pricing for large decreases is reversed-out and the NZ dollar climbs on such changes.
Australian and Japanese interest rate differentials to the USD close-up
Over the last two years the Australian dollar has been held at low levels around 0.6500 against the US dollar due to the fact that their interest rates have been 1.00% below those of the US. Up until recently, the Reserve bank of Australia (“RBA”) under their dual employment and inflation mandate, determined preventing unemployment rising was the reason they only lifted their interest rates to 4.35% to combat higher inflation. In stark contrast, the US and New Zealand increased interest rates to 5.50%. The negative interest rate differential that has kept the AUD weak over this period has now had a fundamental shift and sea change that must change the outlook for the AUD/USD exchange rate.
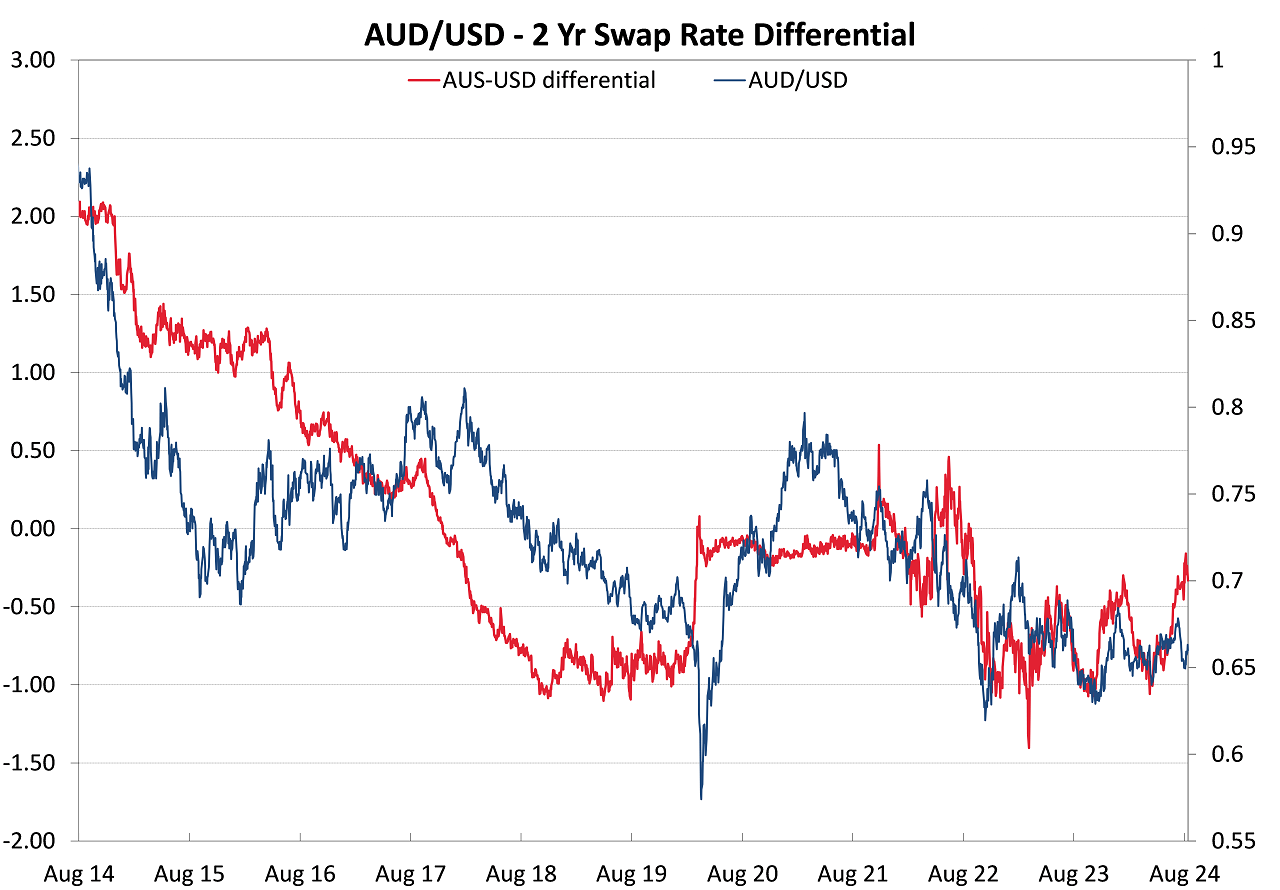
The chart below confirms the dramatic closing-up of the Australian to US interest rate differential from -1.00% to -0.25% over recent weeks (red-line). US two-year interest rates are declining sharply as the Fed prepare to aggressively cut their interest rates over the next 12 months. Australian two-year interest rates are stable to higher as the RBA have confirmed that they will not be cutting their interest rates until February 2025, at the earliest. History tells us that the AUD/USD exchange rate is highly correlated to the two-year interest rate differential. The rapid closing-up of the interest rate differential suggests a higher AUD/USD exchange rate to above 0.7000. The AUD has already recovered to 0.6670 from being sold-off to rates below 0.6400 two weeks ago. Further AUD gains are being tempered by falling iron ore prices (due to excess steel inventories in China). However, we expect the changing interest rate differential to win out against the negative of lower iron ore export commodity prices. The NZD/USD rate will dutifully follow the AUD/USD rate higher.
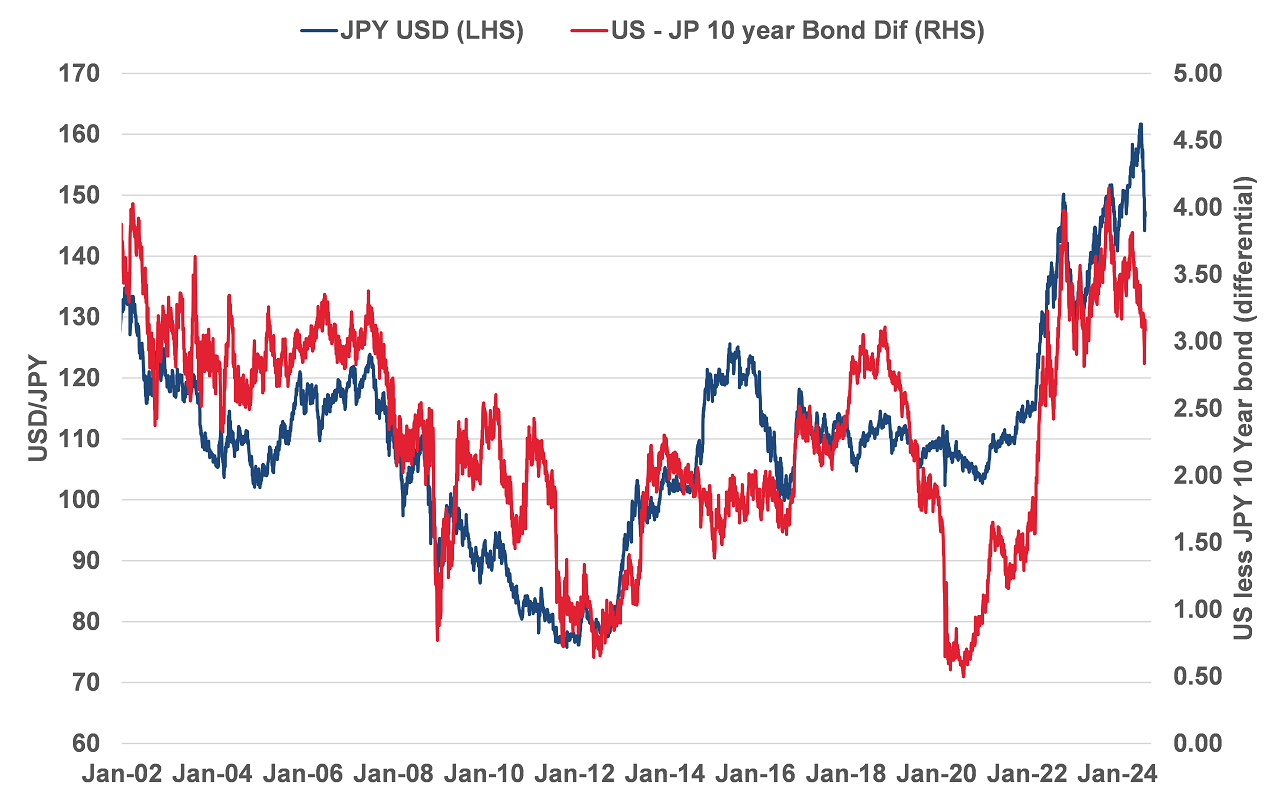
An important long-run determinant of the Japanese Yen exchange rate against the US dollar is the gap between their respective 10-year Government Bond yields. A month ago, US 10-year bond yields at 4.75% were 4.00% above Japanese bond yields at 0.75%. The wide differential resulting in the Yen depreciating to above 160.00 against the USD. Today the equation has substantially changed with the interest rate differential plummeting to 2.75% (3.85% US and 1.10% Japan). The USD/JPY exchange rate closely tracks the changes in the bond yield differential, as the chart below confirms. Further reductions in US bond yields over coming months and further increases in Japanese bond yields (due to the Bank of Japan cutting their bond purchases by 50%) point to the USD/JPY exchange rate moving a lot lower yet to 130.00 and 120.00 over coming months. The expected stronger Yen will contribute to the overall USD Dixy Currency Index depreciating to below 100, and therefore pave the way to allow the much delayed and long anticipated NZD/USD gains to the mid-0.6000’s.
Daily exchange rates
Select chart tabs
*Roger J Kerr is Executive Chairman of Barrington Treasury Services NZ Limited. He has written commentaries on the NZ dollar since 1981.
1 Comments
Excellent analysis. It is not too surprising that the RBNZ came out with the analysis it did, however. RBNZ has favoured hiring people more concerned about climate change ideology than economics. Their analysis is often skewed and deficient when it comes to factoring in what is really going on in NZ. Local councils are filled with such bureaucrats, which is why councils like Nelson just raised their rates another 15%. And then call a big conference because locals are not spending at the shops.
We welcome your comments below. If you are not already registered, please register to comment
Remember we welcome robust, respectful and insightful debate. We don't welcome abusive or defamatory comments and will de-register those repeatedly making such comments. Our current comment policy is here.