

Domestic Log Market
Pruned
Mills still have plenty of pruned supply especially in CNI and Nelson/Marlborough. The usual slow-down in winter supply hasn’t occurred. This may be a function of where crews are located, or maybe we are seeing the start of increasing supply from all the 90’s established forests which were predominantly pruned. Some pruned logs may also be diverted from the export markets to the stronger domestic market.
Structural
Supply and demand for structural logs continues to be well balanced around NZ. There have been some slight increases in log prices for Q3 2017, but generally prices have remained unchanged from Q2. NZ mills have not been affected by the anti-dumping duties imposed on parts of the Canadian soft-wood lumber supply into the US.
Who are the NZ Mills exporting to?
The graphs and charts below from Champion Freight show NZ Sawn Timber Exports. The three largest individual markets (by value) for NZ sawn lumber are the USA, China and Australia. ASEAN countries are also an important market for NZ lumber.
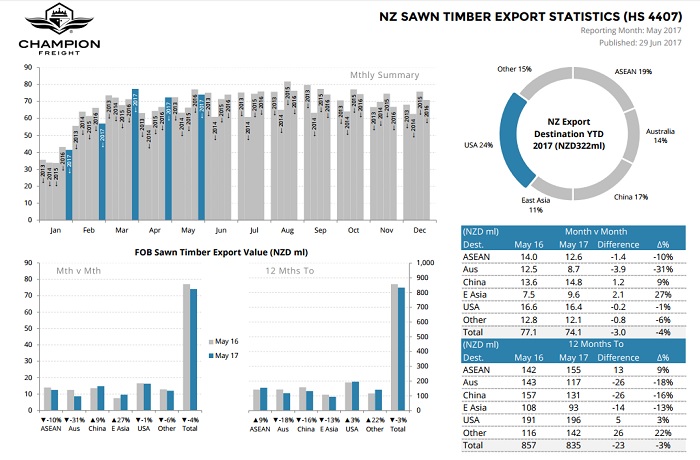
http://www.championfreight.co.nz/sawn_timber.pdf
Export Log Market
China
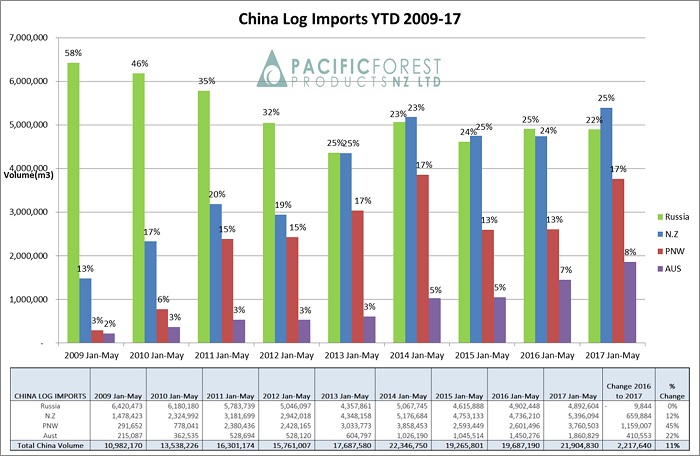
The China log market remains well balanced. Demand remains strong and customers are chasing good volumes. The China market is forecast to remain steady through Q3.
NZ log volume exports to China in 2017 have increased by 12% from 2016.
China softwood inventory is currently 3.1-3.2 million m3. Total stocks have dropped over the last month with higher than expected off-take. PFP report that current daily offtake is 63K. Last month we reported daily offtake was approximately 50-55K. We had thought that the offtake would remain at reduced levels as sawmill workers leave to harvest crops on their family farms, as well as a slow down due to the rainy season. The softwood inventory spread is shown in the graph below.
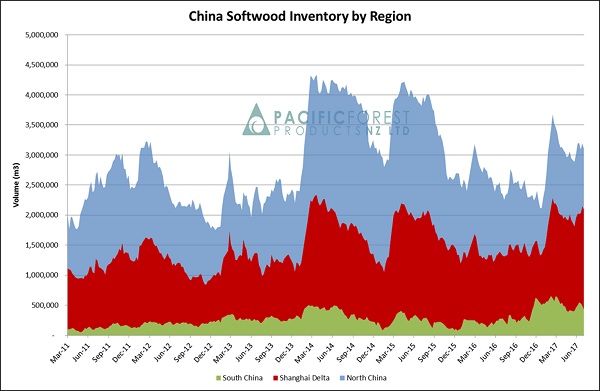
China Log Inventory (Courtesy of PFP)
India
Many of the Indian log buyers have delayed purchasing logs as they contend with the new GST regime in India. Current demand is probably about 20-25% below where log sellers to India expect actual total demand could sit without this interference. This is not concerning exporters as log stocks in India are currently relatively low. Log volume shipped to India in the first six months of 2017 is 7.5% up on the same period last year. This demonstrates a strong underlying demand that should manifest once the dust settles from the GST implementation. The main log port of Kandla in North-western India usually holds stock of about 1.5 months which is 150-180K m3. The port of Tuticorin in Southern India usually has an inventory of 30K m3. Both ports are currently at the lower end of their average stock range. NZ exporters plan to send four vessels to India in July, and another four vessels in August. Exporters forecast an increase in sale prices of approximately $2/m3 for logs shipped in July.
Ocean Freight
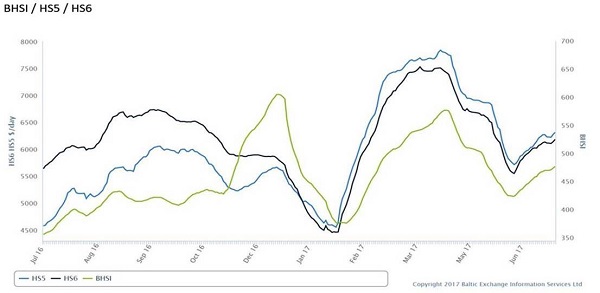
The ocean freight price has remained steady with rates to China remaining in the low $20’s. The Baltic Index over the past year is graphed below. Market forecasters predict a range of flat freight rates over Q4 2017, to a slight rise due to increased demand from grain production.
Foreign Exchange
The NZD relative to the USD has risen from 0.6880 mid-May to 0.7355 in mid-July. This movement alone reduces the AWG return by NZ$12.44/m3 for an A 3.8m with an average sale price of US$133/m3. In fact AWG prices have only dropped an average of $3/m3 over this time. There are exporters competing to maintain or increase their position in the supply chain. We wait to see how long exporters will continue to sustain these artificially higher AWG prices.
PF Olsen Log Price Index to July 2017
The PF Olsen Log Price Index for July has dropped one dollar from the June index figure and is now at $125. The index is now $8 higher than the two-year average, $14 above the three year average and $17 higher than the five-year average.
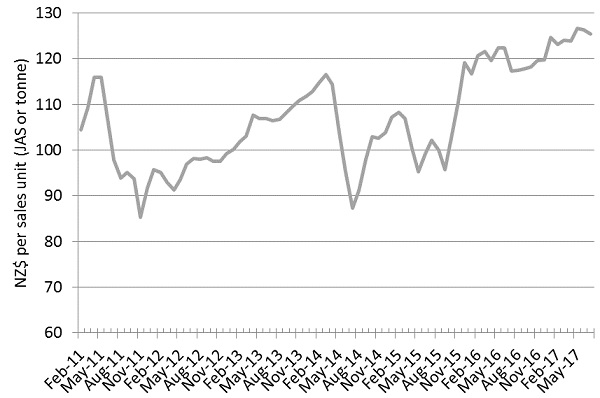
Basis of Index: This Index is based on prices in the table below weighted in proportions that represent a broad average of log grades produced from a typical pruned forest with an approximate mix of 40% domestic and 60% export supply.
Indicative Average Current Log Prices – July 2017
| Log Grade | $/tonne at mill | $/JAS m3 at wharf | ||||||||
| Jul-17 | Jun-17 | May-17 | Apr-17 | Mar-17 | Jul-17 | Jun-17 | May-17 | Apr-17 | Mar-17 | |
| Pruned (P40) | 183 | 188 | 188 | 188 | 187 | 175 | 180 | 180 | 185 | 179 |
| Structural (S30) | 118 | 112 | 113 | 113 | 112 | |||||
| Structural (S20) | 107 | 104 | 103 | 103 | 102 | |||||
| Export A | 139 | 141 | 141 | 136 | 137 | |||||
| Export K | 131 | 133 | 134 | 129 | 130 | |||||
| Export KI | 122 | 125 | 126 | 121 | 121 | |||||
| Pulp | 47 | 50 | 50 | 50 | 50 | |||||
Note: Actual prices will vary according to regional supply/demand balances, varying cost structures and grade variation. These prices should be used as a guide only..
This article is reproduced from PF Olsen's Wood Matters, with permission.

We welcome your comments below. If you are not already registered, please register to comment
Remember we welcome robust, respectful and insightful debate. We don't welcome abusive or defamatory comments and will de-register those repeatedly making such comments. Our current comment policy is here.