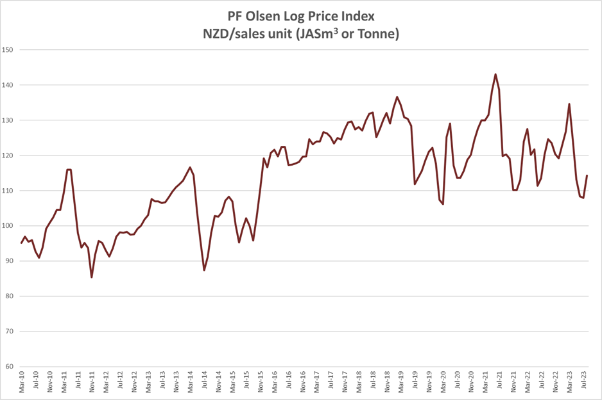
The PF Olsen Log Price Index increased $6 in August to $114. The index is currently $5 below the two-year and $8 below the five-year average.
The domestic market remains subdued.
Domestic Log Market
Rising costs continue to cause significant issues in the construction industry. The Master Builders Association of NZ recently undertook a survey of 1,000 sector participants and 88% said that rising costs was their biggest problem. Many projects are being delayed due to uncertain budgets. New Zealand also tends to go into a holding pattern before a general election.
Record high pulp inventory levels
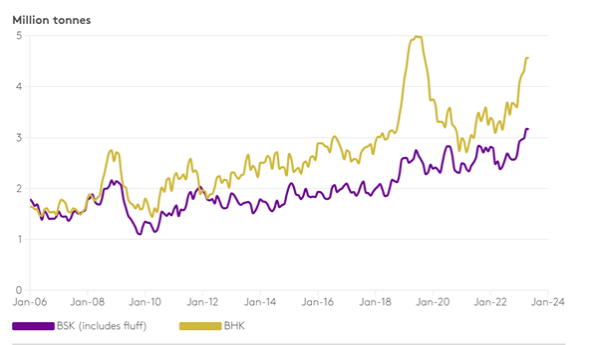
The (BHK) producer inventory volume reading is below the the historical peak in mid-2019, while BSK inventory volumes continue to set new record highs each month. This excess inventory is expected to persist as demand remains low and new supply enters the market.
Total Chemical Market Pulp Producer Inventory

Source: PPFC, Fastmarkets
Export Log Market
China
China radiata log inventory has remained at around 2.7 m3. Daily port off-take has reduced slightly but remains steady ranging between 60-70k m3 per day, which is in the normal range for this time of the year in China.
Macro economic indicators from China continue to worsen which indicates the demand for logs in China will not increase as it usually does when China enters its normally busiest construction time of the year.
The China Caixin Manufacturing PMI continued to fall from 50.5 in June to 49.2 in July. Manufacturing conditions picked up for the second month in a row, but at slower levels then in May. Any PMI number above 50 signals manufacturing growth. This was its lowest reading in six months and the first drop in factory activity since April. New orders dropped after growing in the prior two months while foreign sales contracted the most since September 2022. Buying levels decreased for the first time since January.
India
The demand for pine logs in Kandla is lukewarm due to monsoon rains. Uruguay to Kandla shipments have reduced to only one vessel for August departure and September arrival. CIF price is 118 to 120 USD per JASm3. The price for Uruguay green pine sawn timber in Gandhidham is soft at 491 INR per CFT. Australian radiata pine green sawn timber is sold at 531 INR per CFT. Seasonal demand may occur in Kandla in November, after the Diwali festival.
Tuticorin is sourcing South Africa pine logs in containers at 110 USD levels. Green pine sawn timber is selling within a range of 550 to 575 INR per CFT.
Exchange rates
The strength of the NZD against the USD was similar at the end of July as it was at the end of June. Therefore, the currency had little impact on August AWG prices. The NZD has weakened against the USD through August which will have a positive influence on September AWG prices. The CNY has also weakened against the USD.

NZD:USD
CNY:USD
Currency graphs source: XE
Ocean Freight
Freight costs have increased slightly and two North Island ports loading with one port disload in China costing an average of 32 USD per JASm3.
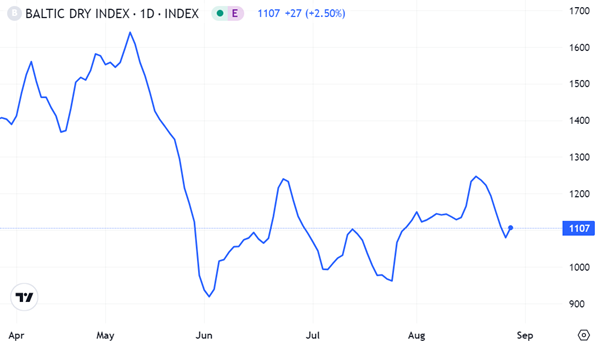
The Baltic Dry Index (BDI) is a composite of three sub-indices, each covering a different carrier size: Capsize (40%), Panamax (30%), and Supramax (30%). It displays an index of the daily USD hire rates across 20 ocean shipping routes. Whilst most of the NZ log trade is shipped in Handysize vessels, this segment is strongly influenced by the BDI.

Source: TradingEconomics.com

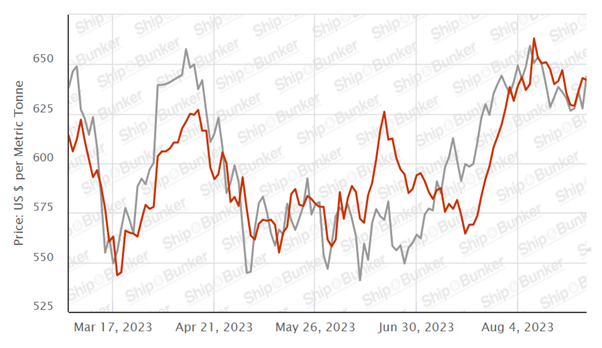
Singapore Bunker Price (VLSO) (red line) versus Brent Oil Price (grey line)
Source: Ship & Bunker
PF Olsen Log Price Index – August 2023
The PF Olsen Log Price Index increased $6 in August to $114. The index is currently $5 below the two-year and $8 below the five-year average.

Indicative Average Current Log Prices – August 2023
| Log Grade | $/tonne at mill | $/JAS m3 at wharf | ||||||||||
| Aug-23 | Jul-23 | Jun-23 | May-23 | Apr-23 | Mar-23 | Aug-23 | Jul-23 | Jun-23 | May-23 | Apr-23 | Mar-23 | |
| Pruned (P40) | 175-200 | 175-200 | 175-200 | 175-200 | 175-200 | 175-200 | 183 | 150-160 | 150-160 | 160-170 | 180-200 | 200-222 |
| Structural (S30) | 120-145 | 120-145 | 120-145 | 120-150 | 120-150 | 120-150 | ||||||
| Structural (S20) | 93-100 | 93-100 | 93-100 | 98-105 | 98-105 | 98-105 | ||||||
| Export A | 120 | 105 | 105 | 110 | 133 | 158 | ||||||
| Export K | 111 | 96 | 96 | 101 | 124 | 149 | ||||||
| Export KI | 102 | 89 | 89 | 94 | 115 | 130 | ||||||
| Export KIS | 93 | 80 | 80 | 85 | 107 | 131 | ||||||
| Pulp | 46 | 46 | 46 | 46 | 46 | 46 | ||||||
Note: Actual prices will vary according to regional supply/demand balances, varying cost structures and grade variation. These prices should be used as a guide only.
A longer series of these prices is available here.
Log Prices
Select chart tabs
This article is reproduced from PF Olsen's Wood Matters, with permission.

We welcome your comments below. If you are not already registered, please register to comment
Remember we welcome robust, respectful and insightful debate. We don't welcome abusive or defamatory comments and will de-register those repeatedly making such comments. Our current comment policy is here.