Domestic demand for logs is steady. New Zealand log processors report domestic sales either at or above the same time last year. However, most log processors expect a drop in demand in Quarter 4.
Export sales of sawn timber are difficult, except for the higher value clearwood grades which are in high demand.
Export demand for logs has not increased at the same pace as global log supply. The CFR price in China has fallen further to stabilise at 110 USD per JASm3 for A grade logs. This fall in CFR prices combined with the strengthening of the NZD against the USD and adverse ocean freight rates, has resulted in June AWG prices dropping an average of $29 NZD per JASm3 from Maypricing , and it is expected AWG prices will fall further again in July.
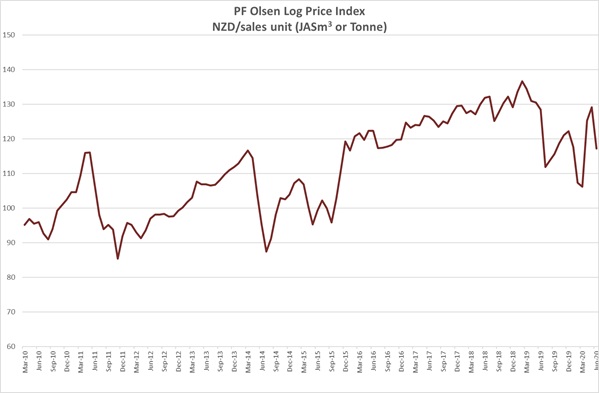
Due to the decreases in export log prices, the PF Olsen Log Price Index decreased $12 in June to $117. The index is currently $7 below the two-year average, $8 below the three-year average, and $5 below the five-year average.
Domestic Log Market
Log Supply and Pricing
There has been sufficent supply for most mills in New Zealand, although mills are now paying closer attention to inventory and keeping low stocks. Prices in some unpruned log grades have dropped $5/t in some regions, but prices for pruned logs have remained stable. Log supply will reduce as smaller forest owners suspend or stop harvesting.
Sawn timber markets
Mills report post Covid-19 lockdown domestic sales of sawn timber higher than the same period last year. This is more likely a combination of catch-up orders from the Covid-19 lockdown, and mills benefitting from some supply capacity taken out of the market, rather than an overall increase in demand. The largest recent closure was the CHH Whangarei sawmill in April, while they also reduced production at their LVL plant by 70% to focus on the domestic market.
DIY sales have been strong as people look to replace holidays with home improvements etc. Builders are also probably finishing or correcting many of the DIY projects started during the Covid-19 lockdown. Sales of decking products as an example were high around the lockdown period and mills don’t know if these are sales that would have happened next summer or are additional sales. Sawmills forecast that sales of trusses and frames for housing will continue, but that high rise developments will slow down considerably. They expect to see this effect as projects finish and new projects do not start, as banks are reluctant to fund new projects. Some are predicting overall domestic demand to fall by up to 20% in Quarter 4.
Exports sales of clear wood sawn timber has been one shining light for NZ log processers. Mills supplying clearwood for North America and European markets are struggling to keep up with demand. Demand in North America for 8-inch and 10-inch wides was especially strong as buyers realised that British Columbia sawmills that are now permanently closed were heavy producers of wide boards.
Export Log Market
China
Log supply into China has increased, with South America and Europe responsible for most of this increase. European supply during Quarter 1 was up over 300% on the last year. Supply from South America will likely reduce as the CFR prices drop in China, but the supply from the damaged spruce forests in Europe will continue as these logs need to be salvaged. The supply line from this salvage harvesting is also not as price sensitive as other supply chains.
Eastbound Silk Road rail volumes increased 44% last month, as forwarders capitalised on “heavy” demand with new block-train services from Germany to China. According to figures from China State Railway Group, eastbound volumes reached 43,000 teu for the month, with the number of trains departing up 39% to 477. And DHL Global Forwarding has launched two new block-trains to meet “heavy customer demand for alternative transport modes and speeding up transit times to Asia”. In late May DHL added another service, from Ludwigshafen to Xi’an, via Poland, Belarus, Russia, and Kazakhstan.
Supply from New Zealand will reduce as New Zealand harvesting slows down in the winter months and many smaller forest owners will suspend, defer, or stop harvesting. There is often a lag in reduction of supply as forest owners complete current jobs, but the harvest of new blocks is deferred.
China can stimulate its construction industry, but it cannot stimulate the markets to which it exports. When compared with the South American and damaged European logs, New Zealand’s radiata logs have superior properties for machining, gluing, painting etc. New Zealand logs therefore have a preferred status with those manufacturers producing furniture, mouldings, machine edged panels etc. But when markets are uncertain and sales for finished products are under pressure, many Chinese manufacturers obviously look to reduce costs in their supply chain. This means they will use the inferior logs, and this places price pressure on the logs from New Zealand.
NZ radiata logs must compete with the lower quality logs in the construction market, where the mostly 19mm film or resin faced plywood and 90 X 50mm sawn timber is used predominantly for concrete formwork. The building process includes the erection of formwork, securing reinforcing steel according to the specification, and pouring the concrete. When the concrete has cured, the formwork is removed and, where possible, reused in subsequent floors of the building.
Log inventory in China is around 3.8m m3 and daily offtake while fluctuating has increased to an average of 60-65k per day but still down from the 75-80k used per day in June last year. The CFR price in China has fallen further to stabilise at 110 USD per JASm3 for A grade logs. This is the same bottom price point as last year.
India
India continues to face Covid-19 issues and demand for sawn timber in Kandla is fluctuating with the price at INR 451 per CFT. Sawmill production is still only about 35% of total capacity. Market speculation is that Kandla will receive one ship in each of July and August from Uruguay. It is difficult for exporters of New Zealand logs to compete with this lower priced and lower grade supply in this weakened market. There are no predictions of when this market may improve.
Exchange rates
The strengthening NZD has reduced the NZ AWG prices for logs in New Zealand. When June AWG prices were offered the NZD was worth about 0.62 USD and is now at 0.64 when exporters are calculating July AWG prices. This change in exchange rates will cause July AWG prices to drop about 6 NZD per JASm3.

NZD:USD

CNY:USD
Ocean Freight
Ocean freight rates have continued to fluctuate in the post Covid-19 world, but have generally increased. At one stage over 60 ships were queuing to berth at Brazil where there was a bumper sugar crop, but port logistics were severely hampered due to Covid-19. While these were larger ships than the handy size vessels that usually transport logs, it takes overall ocean freight capacity out of the system.
Dry bulk ship transits through the Suez Canal were up 42% in total transits year-on-year, an unexpected turn of events given the troubled dry bulk market conditions in 2020. Dry bulker transits have increased to 2,116 in the first five months, a jump of 621 transits compared to last year. 51% of the total dry bulker transits in 2020 were Panamaxes, compared to 44% in the same period last year. Part of the explanation (according to Hellenic Shipping News) could lie at the rebates extended to dry bulkers, but also the IMO 2020 sulphur cap which, in the initial months of 2020, hiked up bunker fuel costs and encouraged shorter sailing distances to save on bunkering costs.
In June the iron ore inventory levels in China were at their lowest level in nearly four years so shippers were anticipating demand to replenish this inventory, along with any stimulation package increasing infrastructure development in China. Brazil is the second largest iron ore supplier to China and this route is one of the longest routes in the seaborne dry bulk trade so has a significant effect on the ocean freight miles supply dynamic.
While there is some short-term demand for shipping driving pricing pressure the medium term is still positive for log exporters. The current weak ship recycling market and shippers’ optimism for increased demand is unlikely to drive aggressive early vessel retirement plans to reduce tonnage capacity. New dry bulk vessel deliveries in 2020 are scheduled to be 9% of the current fleet, the highest amount in 7 years. However, fleet expansion is expected to slow come 2021, when it is projected to grow by only 3%.
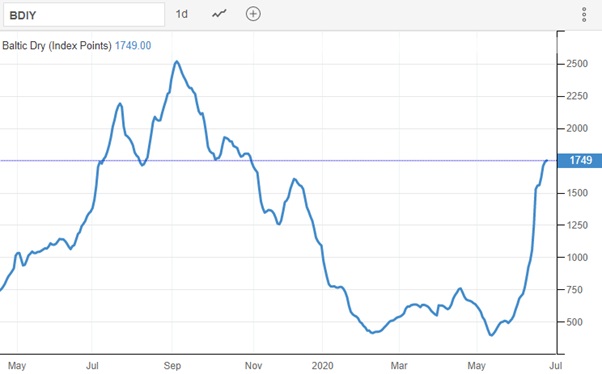
The Baltic Dry Index (BDI) is a composite of three sub-indices, each covering a different carrier size: Capesize (40%), Panamax (30%), and Supramax (30%). It displays an index of the daily USD hire rates across 20 ocean shipping routes. Whilst most of the NZ log trade is shipped in handy size vessels, this segment is strongly influenced by the BDI.

Source: TradingEconomics.com

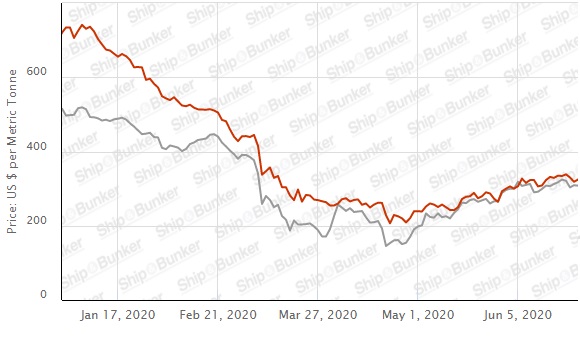
Singapore Bunker Price (IFO380) (red line) versus Brent Oil Price (grey line)
Source: Ship & Bunker
PF Olsen Log Price Index – June 2020
Due to the decreases in export log prices, the PF Olsen Log Price Index decreased $12 in June to $117. The index is currently $7 below the two-year average, $8 below the three-year average, and $5 below the five-year average.

Basis of Index: This Index is based on prices in the table below weighted in proportions that represent a broad average of log grades produced from a typical pruned forest with an approximate mix of 40% domestic and 60% export supply.
Indicative Average Current Log Prices – June 2020
| Log Grade | $/tonne at mill | $/JAS m3 at wharf | ||||||||||
| Jun-20 | May-20 | Mar-20 | Feb-20 | Dec-19 | Nov-19 | Jun-20 | May-20 | Mar-20 | Feb-20 | Dec-19 | Nov-19 | |
| Pruned (P40) | 170-200 | 160-180 | 170-190 | 170-190 | 170-190 | 170-190 | 170 | 180-190 | 140-145 | 140-145 | 160-175 | 160-175 |
| Structural (S30) | 110-120 | 110-120 | 115-125 | 115-125 | 120-130 | 120-130 | ||||||
| Structural (S20) | 105 | 105 | 108 | 110 | 110 | 110 | ||||||
| Export A | 125 | 154 | 103 | 103 | 131 | 129 | ||||||
| Export K | 117 | 146 | 95 | 95 | 124 | 121 | ||||||
| Export KI | 111 | 138 | 83 | 83 | 116 | 114 | ||||||
| Export KIS | 105 | 130 | 80 | 80 | 107 | 105 | ||||||
| Pulp | 46 | 46 | 46 | 48 | 51 | 51 | ||||||
Note: Actual prices will vary according to regional supply/demand balances, varying cost structures and grade variation. These prices should be used as a guide only. There was no September 2019 report.
A longer series of these prices is available here.
Log Prices
Select chart tabs
This article is reproduced from PF Olsen's Wood Matters, with permission.

We welcome your comments below. If you are not already registered, please register to comment
Remember we welcome robust, respectful and insightful debate. We don't welcome abusive or defamatory comments and will de-register those repeatedly making such comments. Our current comment policy is here.