

First home buyers (FHBs) took the smallest share of monthly committed mortgage monies in two-and-a-half years in February, latest Reserve Bank (RBNZ) figures show.
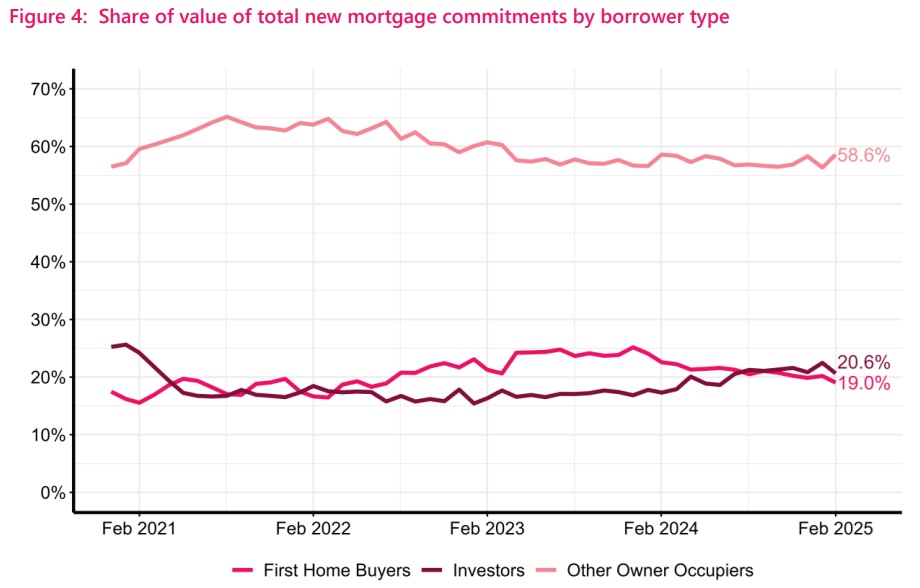
The figures show that in February the FHB grouping took 19% of the $5.847 billion total committed mortgage money.
While the FHB total borrowed, at $1.113 billion, was up on what this same grouping borrowed in January of this year and February 2024, the 19% share of the total is the smallest share since July 2022.
Since peaking at a 25.2% in December 2023 the FHB share has generally been declining.
In terms of the overall figures borrowed in February, the RBNZ says the total was actually down on a seasonally adjusted basis on that borrowed in January by 1.4%.
Compared with previous years the February total is, however, the highest in four years - which is an indication of how much activity fell from the high levels of activity seen in 2020-21.
Investors, long sidelined as the market has languished, have been showing some increased activity since the second half of last year.
They again borrowed more ($1.207 billion) than the FHB grouping in February, but the overall share was down to 20.6% from 22.5% in January 2025.
However, the latest investor total compared with just $851 million borrowed by this grouping in February 2024.
The monthly totals of mortgage commitments don't just include house purchases.
A separate data series published by RBNZ breaks down each month what the mortgages are being used for.
And we can see that switching of loan providers continues to be popular for homeowners at the moment.
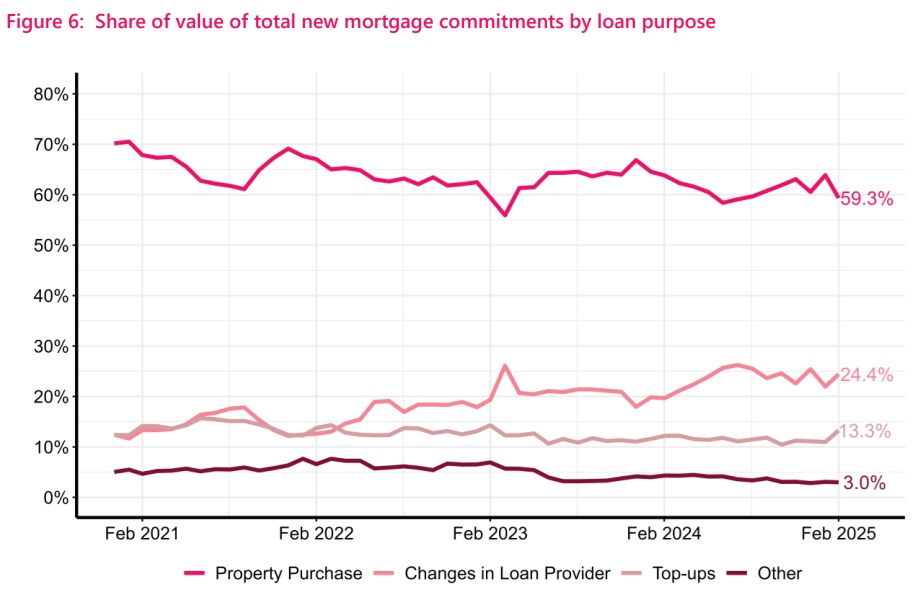
Of the $5.847 billion total mortgage commitments in February, some $1.427 billion was for change of loan provider.
That's a 24.4% share of the total, up from 22% in January.
The percentage high water mark for change of loan provider in this series, which dates back to 2017, is 26.2%, recorded in July 2024.
With banks competing strongly to attract existing homeowners to bring over their mortgages to them, these figures seem set to remain high in coming months - particularly as over 80% of all mortgage holders in the country are either due for a fixed term reset this year or are on floating rates.
Top ups hit their highest percentage share in February for two years.
8 Comments
These statistics are messed up by the growth in 'change in loan provider'. That needs to be netted out.
Also, I am puzzled by the presence of Figures 4 and 6 but the absence of Figures 1, 2, 3 and 5.
What I would like to see is the loans for property purchase for FHBs, subsequent HBs (i.e. those stepping up the ladder) and investors, with all expressed in inflation-adjusted dollars.
Only then would I be able to work out what is really happening.
KeithW
Aha, what I can now see by going back to the Reserve Bank data is that there is a squeeze going on with FHBs getting squeezed out by investors. That appears to have been going on for the last two years. For me, that is the big picture.
KeithW
Thanks David. However I fear the historical data is confounded by 'new mortgages' being different than 'new mortgages for purchase'. Going forward, we need to see the 'new mortgages for purchase' by various buyer categories on a monthly basis, including the figures once inflation adjusted. Of course inflation-adjusted figures would not be available for the latest monthly figures because of delays in reporting inflation, whereas lending figures are available very quickly. These numbers would be great lead indicators.
KeithW
1 out of 8 loans are for topups
And for people who have a lot of equity, why not.
The 1 in 8 my be well less then an 1/8th of the totals being lent.
That chart shows value, not number of loans.
More and more over leveraged are renewing of off lowest rates in history. Enjoy.
We welcome your comments below. If you are not already registered, please register to comment
Remember we welcome robust, respectful and insightful debate. We don't welcome abusive or defamatory comments and will de-register those repeatedly making such comments. Our current comment policy is here.