Investment

Analysis by the World Gold Council.
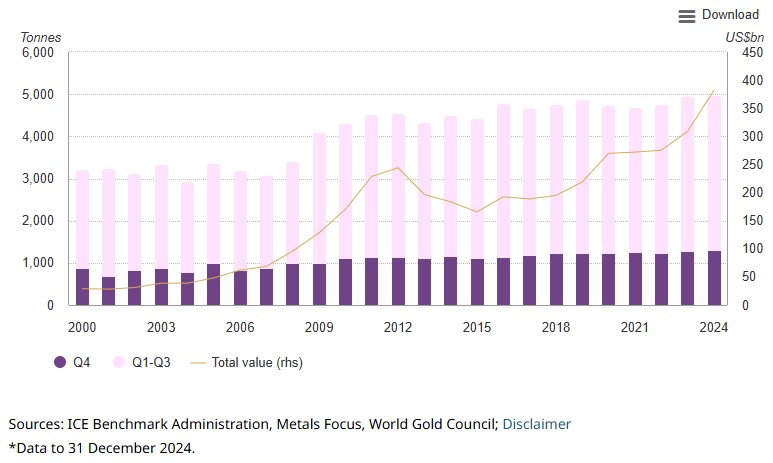
Total gold demand (including OTC investment) rose 1% y/y in Q4 to reach a new quarterly high and contribute to a record annual total of 4,974t.
Central banks continued to hoover up gold at an eye-watering pace: buying exceeded 1,000t for the third year in a row, accelerating sharply in Q4 to 333t.
Annual investment reached a four-year high of 1,180t (+25%). Gold ETFs had a sizable impact: 2024 marked the first year since 2020 in which holdings were essentially unchanged, in contrast to the heavy outflows of the prior three years.
Full-year bar and coin demand was in line with 2023 at 1,186t. The composition shifted as bar investment grew and coin buying reduced.
Annual technology demand was also additive to the global total: it grew by 21t (+7%) in 2024, largely driven by continued growth in AI adoption.
Gold jewellery was the clear outlier: annual consumption dropped 11% to 1,877t as consumers could only afford to buy in lower quantities. Nonetheless, spend on gold jewellery jumped 9% to US$144bn.
Highlights
Chart 1: Gold demand at record levels for Q4 and full year
Quarterly gold demand in volume, tonnes, and value, US$bn*
Gold supply and demand
Table 1: Gold supply and demand by sector, tonnes
| 2023 | 2024 | Annual y/y % change |
Q4'23 | Q4'24 | Quarterly y/y % change |
|||
| Supply | ||||||||
| Mine production | 3,644.1 | 3,661.2 | 0 | 955.4 | 953.6 | 0 | ||
| Net producer hedging | 67.4 | -56.8 | - | 19.9 | -15.0 | - | ||
| Recycled gold | 1,234.4 | 1,370.0 | 11 | 311.2 | 358.8 | 15 | ||
| Total Supply | 4,945.9 | 4,974.5 | 1 | 1,286.5 | 1,297.4 | 1 | ||
| Demand | ||||||||
| Jewellery fabrication | 2,191.0 | 2,003.5 | -9 | 583.6 | 516.5 | -12 | ||
| Jewellery consumption | 2,110.6 | 1,877.1 | -11 | 620.9 | 547.1 | -12 | ||
| Jewellery inventory | 80.4 | 126.4 | 57 | -37.3 | -30.6 | - | ||
| Technology | 305.2 | 326.1 | 7 | 82.2 | 83.7 | 2 | ||
| Electronics | 248.7 | 270.6 | 9 | 67.6 | 69.6 | 3 | ||
| Other Industrial | 47.1 | 46.5 | -1 | 12.3 | 11.9 | -4 | ||
| Dentistry | 9.4 | 8.9 | -5 | 2.3 | 2.2 | -6 | ||
| Investment | 945.5 | 1,179.5 | 25 | 259.8 | 344.0 | 32 | ||
| Total bar and coin | 1,189.8 | 1,186.3 | 0 | 315.2 | 325.4 | 3 | ||
| Bars | 781.7 | 860.0 | 10 | 223.1 | 236.2 | 6 | ||
| Official coins | 293.5 | 201.0 | -31 | 60.3 | 53.4 | -11 | ||
| Medals/Imitation coins | 114.6 | 125.2 | 9 | 31.9 | 35.8 | 12 | ||
| ETFs & similar products | -244.2 | -6.8 | - | -55.4 | 18.6 | - | ||
| Central banks & other inst. | 1,050.8 | 1,044.6 | -1 | 216.8 | 332.9 | 54 | ||
| Gold demand | 4,492.5 | 4,553.7 | 1 | 1,142.4 | 1,277.1 | 12 | ||
| OTC and other | 453.4 | 420.7 | -7 | 144.1 | 20.3 | -86 | ||
| Total Demand | 4,945.9 | 4,974.5 | 1 | 1,286.5 | 1,297.4 | 1 | ||
| LBMA Gold Price (US$/oz) | 1,940.5 | 2,386.2 | 23 | 1,971.5 | 2,663.4 | 35 | ||
Source: Metals Focus, Refinitiv GFMS, ICE Benchmark Administration, World Gold Council
Note: For an explanation of these terms, please see the Notes and definitions download:
https://www.gold.org/goldhub/data/gold-demand-by-country
Outlook
We expect central banks to stay in the driving seat and gold ETF investors to join the fray. Jewellery demand will remain under pressure and we may see further growth in recycling. Mine supply is expected to remain robust
The macroeconomic backdrop we laid out in our Gold Outlook 2025 is broadly in line with market expectations with some changes, partly reflected by less aggressive rate cuts by central banks.
In line with consensus economic estimates, the following developments are likely in the four major gold regions:1
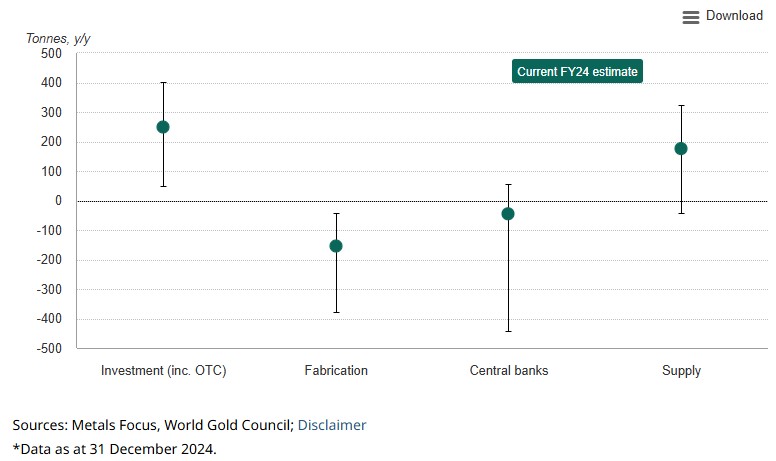
Chart 2: We see central banks and ETF investors at the forefront, while consumer-led sectors face challenges in 2025
Expected change in annual gold demand*
Investment
We see tailwinds for gold ETF, OTC and futures-based investment stemming from generally lower interest rates, richly valued equities, a softer US dollar and geopolitical risk mostly expressed though trade and economic uncertainty.
We expect the trajectory for rates in the US will be down but bumpy, given the Trump administration’s all-out pro-growth agenda stoking temporary inflationary fires in a late business cycle. This uncertainty is likely to keep term premia intact and the bond-equity correlation elevated – a positive for gold. In addition, there’s potential for US dollar weakness stemming from a combination of ‘extreme’ overvaluation2 and a push for both lower rates and a more competitive dollar by the administration,3 as well as a likely narrowing in German Bund-US Treasury spreads as German elections push local growth policies to the fore.
Regionally, gold ETF investment in the US has the potential to bring in substantial flows overall, even if we see transient periods of outflows. In Europe, the ECB is expected to cut rates by 1% during 2025.4 This could be enough to get some European ETF investors back in the fold. However, it might be a slow return given that real rates remain attractively positive at close to 1%, one factor that anecdotally drove investors out of European ETFs in 2023.
China’s ETF demand hit a record in 2024. We expect robust rather than remarkable demand there this year, with tailwinds from RMB weakness and declining benchmark yields fighting headwinds from the high base and the possibility for risk-on sentiment.
In the bar and coin segment, the outlook is a little less rosy. In the West, economic malaise in Europe and high prices are likely to weigh on demand as will declining inflation fears and conflict risk, but lower interest rates might attract European activity back in H2. In the US, Republican presidencies have historically been accompanied by below-average bar and coin demand; however, the geopolitical environment could soften the pullback. Chinese and Indian demand is likely to remain robust but slightly weaker than 2024 as growth slows in India and equity and real estate markets recover somewhat in China offering alternatives to domestic investors.
Fabrication
If the gold price remains at current or higher levels, it could further erode jewellery demand, particularly as growth is also weak or slowing in all four major gold regions. China faces a pessimistic outlook should the economy continue to slow and prices stay high or rise. A glimmer of hope may come from benchmark lending rates which have come down, which could entice a pickup in activity.
More auspicious wedding days can provide some support to jewellery demand in India following a resilient 2024. Key to the fortunes of Indian jewellery buying is stable prices. With economic growth set to slow but still humming along at an impressive pace, price volatility becomes a key determinant for demand in 2025. Elsewhere, the familiar tale of softer economic growth and high prices will likely exert pressure on demand in 2025.
Continued capital investment in AI and its related infrastructure should ensure technology demand remains solid in 2025. Other electronic demand will likely continue to be weighed down by economic uncertainty in China and Europe.
Central Banks
Having positively surprised for three years in a row, there’s more evidence that supports the idea that central banks can repeat again their 1,000t-plus net buying in 2025. However, we reserve caution by reflecting it in potential downside risk rather than our central view.
We believe that armed conflict giving way to global trade and economic conflict may support central bank’s net buying trend. We can see this in part by the pickup and broadening of demand, especially in Q4. Further, central banks seem to have taken advantage of temporary pullbacks in the gold price as entry points, while sales remained limited and mostly tactical as the price rose. Yet, forecasting demand for central banks is inherently challenging given that it’s often linked to policy decisions and not just macroeconomic drivers, leading us to widen the band of uncertainty around our estimate – mostly to the downside. For example, recent announcements of sales to manage currency volatility5 leads us to account for the risk further such developments elsewhere.
Supply
High margins provide an incentive for mine production to reach new highs, but downside risks remain. This year’s total was lower than previously anticipated, so we attach caution to a material rise, despite near-record AISC margins currently. De-hedging’s contribution to the lower mine supply figure could also be a factor next year as miners anecdotally opt for exposure to the spot price.
Recycled gold supply breached 350t in Q4 for only the fourth time in a decade. The trend is rising and tonnage is expected to increase again in 2025 on the back of slowing global economic growth, a high gold price level, and a slight reduction in the geopolitical risk premium that’s been key to dampening supply for the past two years. Constraining higher recycling is a lack of near market supplies in China and Western markets.
This article is a re-post from here.
![]() Our free weekly precious metals email brings you weekly news of interest to precious metals investors, plus a comprehensive list of gold and silver buy and sell prices.
Our free weekly precious metals email brings you weekly news of interest to precious metals investors, plus a comprehensive list of gold and silver buy and sell prices.
To subscribe to our weekly precious metals email, enter your email address here. It's free.
Comparative pricing
You can find our independent comparative pricing for bullion and coins in both US dollars and New Zealand dollars which are updated on a daily basis here »
Gold will only head higher as the money printers hit high gear and rates are forced downwards ..we see escalation of trade resource wars ..GOLD is above all the geo-political fiat fake debt fuelled money scam
Gold - aside from last year's ripping 25% and 2023 12% is marginal at best in real terms. Annualised returns of 4.1% since 2011. At best you are staying still.
Nasdaq 100 is running at 18% annualised and Bitcoin at 147%. https://bilello.blog/2025/2024-the-year-in-charts?utm_source=charlies-n…
But you do you
We welcome your comments below. If you are not already registered, please register to comment
Remember we welcome robust, respectful and insightful debate. We don't welcome abusive or defamatory comments and will de-register those repeatedly making such comments. Our current comment policy is here.