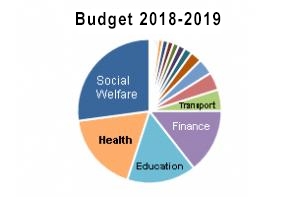
This table outlines the New Zealand Government's planned spending for the 2018/19 budget year.
Actual spending for the previous four years is on the left.
The numbers are drawn together from data released by the Minister of Finance on May 17, 2018.
Links to the primary sources used, from Treasury's website, can be found at the bottom of the page.
Click on any heading to drill down to what makes up these numbers. Figures for each allocation are in millions of NZ$.
| Actual 2014/15 | Actual 2015/16 | Actual 2016/17 | Actual 2017/18 | Budget 2018/19 | % | |
| NZ$m | NZ$m | NZ$m | NZ$m | NZ$m | ||
| 349.9 | 217.5 | - | - | Canterbury Earthquake Recovery (old) | - | - |
| 3.2 | 3.3 | 3.4 | 3.4 | Parliamentary Commissioner for the Environment | 3.8 | 0.0 |
| 5.4 | 4.7 | 4.7 | 5.3 | Women | 5.4 | 0.0 |
| 9.2 | 9.1 | 9.5 | 11.2 | Serious Fraud | 9.8 | 0.0 |
| 8.6 | 8.9 | 9.3 | 10.9 | Pacific Peoples | 10.4 | 0.0 |
| - | - | - | 4.2 | Pike River Re-entry | 17.1 | 0.0 |
| 12.2 | 12.5 | 15.0 | 18.6 | Ombudsmen | 21.7 | 0.0 |
| 20.1 | 20.3 | 22.9 | 23.6 | Office of the Clerk | 22.6 | 0.0 |
| 18.6 | 19.2 | 21.8 | 23.3 | Parliamentary Counsel | 23.3 | 0.0 |
| 28.8 | 29.6 | 28.4 | 33.7 | Education Review Office | 30.1 | 0.0 |
| 40.7 | 41.4 | 44.0 | 64.8 | State Services | 60.0 | 0.1 |
| 56.8 | 61.2 | 66.8 | 68.8 | Attorney-General | 70.9 | 0.1 |
| 46.3 | 60.0 | 110.4 | 136.8 | Prime Minister and Cabinet | 76.7 | 0.1 |
| 44.8 | 50.2 | 57.1 | 68.6 | Security Intelligence | 81.8 | 0.1 |
| 89.5 | 84.2 | 89.2 | 89.2 | Sport and Recreation | 89.2 | 0.1 |
| 87.4 | 89.4 | 90.9 | 95.2 | Audit | 94.3 | 0.1 |
| - | - | - | - | Forestry | 138.5 | 0.1 |
| 86.8 | 132.9 | 114.0 | 138.6 | Communications Security and Intelligence | 153.3 | 0.1 |
| 122.0 | 143.5 | 156.3 | 209.0 | Statistics | 154.6 | 0.2 |
| 142.0 | 148.8 | 150.0 | 172.3 | Parliamentary Service | 155.7 | 0.2 |
| 192.3 | 193.3 | 197.5 | 219.3 | Customs | 230.6 | 0.2 |
| 399.2 | 227.5 | 299.6 | 251.7 | Defence | 314.6 | 0.3 |
| 214.0 | 240.9 | 291.8 | 328.7 | Maori Development | 316.4 | 0.3 |
| 283.2 | 274.6 | 326.6 | 300.4 | Arts, Culture and Heritage | 322.7 | 0.3 |
| 165.7 | 474.8 | 176.1 | 349.7 | Treaty Negotiations | 401.1 | 0.4 |
| 438.5 | 529.9 | 525.1 | 551.1 | Justice | 479.0 | 0.5 |
| 392.2 | 416.6 | 440.0 | 448.0 | Conservation | 491.1 | 0.5 |
| 442.1 | 441.8 | 456.3 | 478.2 | Foreign Affairs and Trade | 549.6 | 0.5 |
| 219.5 | 216.3 | 292.3 | 550.4 | Lands | 598.2 | 0.6 |
| 546.1 | 556.3 | 625.0 | 710.8 | Internal Affairs | 666.0 | 0.7 |
| 410.7 | 259.2 | 316.8 | 491.7 | Building and Housing | 732.9 | 0.7 |
| 629.9 | 703.9 | 719.3 | 1,014.4 | Agriculture, Biosecurity, Fisheries and Food Safety | 745.4 | 0.7 |
| 568.2 | 592.1 | 592.2 | 713.5 | Official Development Assistance | 768.4 | 0.8 |
| 643.7 | 673.5 | 690.8 | 751.2 | Courts | 776.4 | 0.8 |
| 254.7 | 295.7 | 442.8 | 955.2 | Environment | 813.3 | 0.8 |
| - | - | 156.6 | 884.3 | Oranga Tamariki | 951.9 | 0.9 |
| 1,595.7 | 1,626.3 | 1,679.9 | 1,775.3 | Police | 1,873.6 | 1.8 |
| 1,493.4 | 1,543.3 | 1,601.7 | 1,794.0 | Corrections | 1,965.7 | 1.9 |
| 1,360.5 | 1,532.7 | 1,704.3 | 1,877.5 | Labour Market | 2,004.1 | 2.0 |
| - | - | - | 2,358.5 | Social Housing | 2,772.3 | 2.7 |
| 1,963.7 | 2,068.2 | 1,934.3 | 2,491.3 | Business, Science and Innovation | 3,040.6 | 3.0 |
| 2,983.1 | 2,876.2 | 3,010.8 | 3,149.0 | Defence Force | 3,440.1 | 3.4 |
| 2,999.8 | 3,029.6 | 2,991.8 | 3,228.4 | Tertiary Education | 3,444.2 | 3.4 |
| 3,959.3 | 3,514.6 | 3,667.9 | 5,619.1 | Transport | 5,373.5 | 5.3 |
| 5,308.8 | 7,097.4 | 5,307.7 | 5,303.4 | Finance | 5,996.8 | 5.9 |
| 6,064.9 | 5,696.8 | 5,663.7 | 5,917.1 | Revenue | 7,223.1 | 7.1 |
| 10,243.6 | 10,741.7 | 11,094.7 | 11,777.4 | Education | 12,260.2 | 12.0 |
| 15,033.7 | 15,279.8 | 18,395.0 | 16,544.1 | Health | 18,225.4 | 17.8 |
| 23,221.3 | 23,978.9 | 24,861.5 | 22,908.4 | Social Development | 24,284.9 | 23.7 |
| 83,200.2 | 86,218.5 | 89,455.5 | 94,919.7 | Grand Total | 102,281.4 | 100.0 |
| 245,013 | 257,716 | 274,290 | 290,750 | GDP (nominal, per RBNZ) | 303,700 | E |
| 34.0% | 33.5% | 32.6% | 32.6% | Govt spending - % of GDP | 33.7% | E |
| and this compares with taxes collected as follows: | ||||||
| 83,199.9 | 88,230.7 | 93,623.8 | 97,949.5 | Total tax collected | 103,329.4 | |
| click on this link for details | ||||||
Sources: You can download the data behind these tables from the NZ Government website here»
12 Comments
Am I missing something? According to the above figures we will spend less on Health than the previous year.
and edited for stupidity, apologies, completely missed the far right column.
that was an error on our part, which has now been fixed.
AND just look at Social Welfare ............ almost as much as Health and education combined .
That pesky Accommodation Supplement which is nothing more than a drip directly into Landlords arteries needs to be turned off .
The largest Social Welfare cost - by far - is for NZ Superannuation. $14.5 bln or almost 60% of the Social Welfare budget. We will have drilldown detail up tomorrow.
Woah, woah, woah David, we can't have that kind of chat, stop with your facts and stuff.
Although Boatie is right, we do need to stop the landlord subsidies, I'm pretty sure their "hard-earned" capital gains that they've worked so hard for, should suffice without the need for further augmentation.
$14.5B on superannuation that is crazy.
err you could ask the pensioners for means testing (by and far the largest cost & majority of social welfare) but they would be pretty annoyed at any reductions. They might even stage a protest, not online but the sort of sit in types.
.
Great effort David.
I watched the pitch this afternoon but we really need the numbers to understand what is going on.
Didnt hear a word this afternoon about the $500 million added to the tertiary sector, hope its not a bailout for those loss making polytechnics.
.
We welcome your comments below. If you are not already registered, please register to comment
Remember we welcome robust, respectful and insightful debate. We don't welcome abusive or defamatory comments and will de-register those repeatedly making such comments. Our current comment policy is here.