
Here's our summary of key economic events overnight that affect New Zealand with news the US Federal Reserve is meeting to review its monetary policy settings and uncertainty levels are high and rising, both on the growth and inflation fronts.
But first, as we noted yesterday, China's State Council has launched 'a special action plan' to boost domestic consumption, including increasing residents' income and establishing a childcare subsidy scheme. The plan came a week after the Premier's work report to the National People's Congress, which focused on boosting household spending to cushion the impact of weak external demand.
This had a notable impact on many, mainly Asian, financial markets.
Meanwhile, China released an important set of recent data overnight. Their new home prices in 70 cities dropped by -4.8% year-on-year in February, easing from a -5.0% decline in January. This marked the 20th consecutive month of decreases but represented the softest pace since last June. For second hand home prices, they are down -7.5% year-on-year.
China's retail sales were up +4.0% in the January/February period, a better rise than for any month, other than for October.
China's industrial production was said to be up a strong +5.9% in the same period. However that doesn't quite square with their electricity production data in the same period which was -1.3% lower.
Singapore's exports recovered in February after the disappointing January data. There were up +7.6% after falling -2.1% in January. However, that bounceback was weaker than analysts had expected (+8.7%).
Indian exports were unremarkable in February, coming in just under US$37 bln and still low for an economy of this size, certainly one that is 'booming'. In India, it is all about internal demand. For reference, India's exports were US$41.4 bln in February 2024, so a shrinkage of -11% on that basis. They may be looking for new markets to shore up this weak performance.
Legendary investor Warren Buffett once said his strategy is to be fearful when others are greedy, and greedy when others are fearful. Right now, market fears are high, in fact 'extreme'. So what is he doing? He is raising his stakes in Japanese trading houses.
US retail sales in February were a disappointment. They fell -0.2% from January when a rise was anticipated and are now -0.9% lower than year ago levels. On an inflation-adjusted basis it will be worse than that. January data was soft too, and revised lower. Seven of the report’s 13 categories recorded declines, including car sales on a year-on-year basis. This data is consistent with earlier data indicating defensive consumer attitudes.
A 'fear' retreat by American consumers will likely have more of a global impact on trade and consumption than tariffs by themselves.
That same hesitancy also shows up in the NAHB/Wells Fargo Housing Market Index which fell in March to its lowest level in seven months, and below what was expected. Current sales conditions fell sharply, sales expectations in the next six months held steady, while traffic of prospective buyers dropped sharply too. And not helping the builders is cost uncertainty.
It is even tougher in the latest update of the Empire State factory survey by the New York Fed. This is often a volatile survey, but the March results record the largest pullback since May 2023. New order intake levels were particularly weak. Capital spending was very weak too. The New York Fed called the retreat "significant".
But at least national business inventories in relation to sales activity are still within range, even if they did rise in February.
In Canada, housing starts fell -4% in February to an annual rate of 229,030 units, down from a revised 239,322 units in January and below market expectations of 250,000.
Less trade has seen the OECD trim its 2025 and 2026 forecasts for economic expansion. Annual GDP growth in the United States is projected to slow from its +2.8% 2024 pace, to be +2.2% in 2025 and +1.6% in 2026. China's growth rates are slowing too. But they do expect improvements in Australia. (See page 5.) They see inflation rising to above policy target levels. New Zealand gets no mention in this update.
The UST 10yr yield is now at 4.30%, down -2 bps from yesterday at this time. The key 2-10 yield curve is lower at +26 bps. Their 1-5 curve inversion is now -4 bp. And their 3 mth-10yr curve inversion is -3 bps. The Australian 10 year bond yield starts today at 4.44% and up +2 bps from yesterday. The China 10 year bond rate is now at 1.95% and up +6 bps. The NZ Government 10 year bond rate is now at 4.70%, up +2 bps from yesterday.
Wall Street has opened its Monday trade with the S&P500 up +0.8%. Overnight European markets all closed up +0.6%. Yesterday, Tokyo closed up +0.9%. Hong Kong ended its Monday session up +0.8%. Shanghai was up +0.2%. Singapore was up +0.6%. The ASX200 ended its Monday trade up +0.2%. But the NZX50 was the outlier, falling -0.8% in Monday trade.
The price of gold will start today at just on US$2994/oz and up another net +US$9 from yesterday.
Oil prices are up +50 USc from yesterday at just on US$67.50/bbl in the US and the international Brent price is at just on US$71/bbl.
The Kiwi dollar is now at 58.2 USc and up +70 bps from this time yesterday. That is its highest level since December 10, 2024. Against the Aussie we are up +30 bps at 91.2 AUc and a similar three-month high. Against the euro we are up +40 bps at 53.2 euro cents. That all means our TWI-5 starts today just under 67.3, and up +50 bps to a two month high.
The bitcoin price starts today at US$83,439 and down just -0.2% from this time yesterday. Volatility over the past 24 hours has again been modest at +/- 1.2%.
Daily exchange rates
Select chart tabs

The easiest place to stay up with event risk is by following our Economic Calendar here ».
33 Comments
https://natehagens.substack.com/p/the-7-fundamental-drivers-of-overshoot
#2 is relevant.
Makes a lot of short-term, money-fixated comment look (place appropriate word here)
Money is almost always a distraction from the real world of physical resources, goods and services. I'm not as joyfully convinced of our doom as pdk, but when you think about the physical it seems bonkers and unsustainable for our default response to economic challenges to be to try to trigger *more* consumption.
The easy way to think about is that everyone is in a bidding war for real resources (in decline)...and the auction is global.
Add to that if one entity is unwilling to sell at any price then the currency becomes force.
How well does anyone think they are going to perform in such a system?
Reduction in consumption is built in - the economic headwinds you speak of are going to be lack of consumption not excess. Handwringers only need to stick to the real world of basic biology rather than delve in to non-scientific terms like "overshoot", "degrowth" mumbo jumbo.
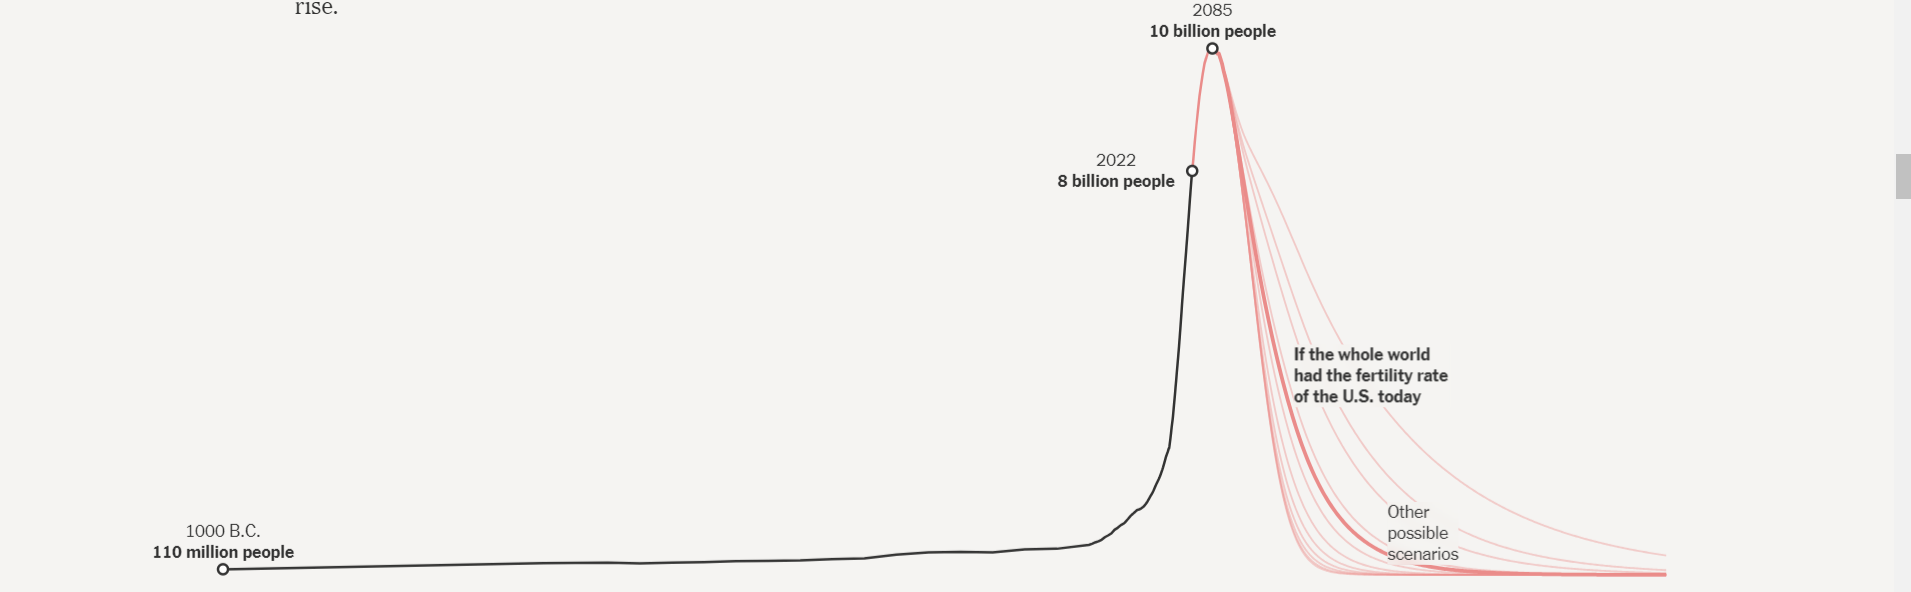
"Assuming the continuation of the current trajectory of our fertility and mortality (and even with some variation), the exponential population growth of the mid-20th century (doubling time of 37 years) is about to flip to an asymptotic decline, with the population halving every about 40 years."
"People underestimate how quickly this effect will be felt. South Korea currently has a total fertility rate of 0.81. For every 100 South Korean great-grandparents, there will be 6.6 great-grandkids. At the 0.7 fertility rate predicted in South Korea by 2024, that amounts to 4.3 great-grandkids. It’s as if we knew a disease would kill 94 percent of South Koreans in the next century."
https://afterthespike.com/media/nyt_pic.png
https://insightplus.mja.com.au/2024/8/health-care-in-for-a-roller-coast…
Overshoot and degrowth are science. Ecology 101.
Not mumbo-jumbo - that's spin 101; denigrate the message. That's your happy place.
Secondly, the time-lines are different. We are overshot NOW. The impacts are NOW.
A 40-year lead-time is - by any definition - not NOW.
'We are in overshoot now.".... and have been for some years. Sadly this remains widely unrecognised.
Reviewing studies of degrowth: Are claims matched by data, methods and policy analysis?
...(2) the large majority (almost 90%) of studies are opinions rather than analysis; (3) few studies use quantitative or qualitative data, and even fewer ones use formal modelling; (4) the first and second type tend to include small samples or focus on non-representative cases; (5) most studies offer ad hoc and subjective policy advice, lacking policy evaluation and integration with insights from the literature on environmental/climate policies;
https://www.sciencedirect.com/science/article/pii/S0921800924002210
What is the human (sustainable) carrying capacity of this planet and at what level of extraction of resources and resulting by products?
The most comprehensive study of this question determined that we were already in a pattern of overshoot 5 decades ago.
One of those fellows got a Shell-sponsored prize and is economics-trained.
There are a lot of them about, and Profile's slant is consistent...
A curious feature is that there has been no comparable study done since that refutes the findings of LtG....you would think that the likes of the oil industry or such would be all over that like a rash. Indeed the reviews of LtG continue to support the initial findings.
Go figure.
Of course members of general public are free to carry out their own modelling...assuming they have the resources, expertise and time to do so.
New York Times summed it up pretty well at the time. Are you ever curious as to why we didn't all starve, or that oil/gas/coal production would be at record levels in 2024 and proven oil reserves increased from 300 billion barrels in 1972 to 1.7 trillion today?
"...“The Limits to Growth,” in our view, is an empty and misleading work. Its imposing apparatus of computer technology and systems jargon conceals a kind of intellectual Rube Goldberg device—one which takes arbitrary assumptions, shakes them up and comes out with arbitrary conclusions that have the ring of science. “Limits” pretends to a degree of certainty so exaggerated as to obscure the few modest (and unoriginal) insights that it genuinely contains. Less than pseudoscience and little more than polemical fiction, “The Limits to Growth” is best summarized not as a rediscovery of the laws of nature but as a rediscovery of the oldest maxim of computer science: Garbage In, Garbage Out.
...As a first approximation of the future, the authors assume that the world is utterly incapable of adjusting to problems of scarcity. Technology stagnates and pollution is ignored, even as it chokes millions to death. A shortage of raw materials prevents industry and agriculture from keeping up with population growth. World reserves of vital materials (silver, tungsten, mercury, etc.) are exhausted within 40 years."
https://www.nytimes.com/1972/04/02/archives/the-limits-to-growth-a-repo…
" Are you ever curious as to why we didn't all starve, or that oil/gas/coal production would be at record levels in 2024 and proven oil reserves increased from 300 billion barrels in 1972 to 1.7 trillion today?"
Obviously you have never read Limits to Growth or even a synopsis or you would realise that the population decline wasnt modelled to begin by now nor food production to decline by now either. As to 'proven' reserves they are an estimate of economically recoverable volumes with the technology available at the time...key words being estimate and economically.
Another feature of the study is the multiple scenario pathways that do indeed account for the ability for behaviour change, technology and substitution....the fact that even with those actions and we are still tracking the BAU path as indicated would occur without should increase cause for concern.
Yes, I have looked at their schoolboy diagrams and assumptions - the NYT got it about right back in the day. I'm surprised there were not more headlines that time copper ran out.
"Copper, with a 36-year lifetime at the present usage
rate, would actually last only 21 years at the present rate of
growth, and 48 years if reserves are multiplied by five. It is
clear that the present exponentially growing usage rates greatly
diminish the length of time that wide-scale economic growth
can be based on these raw materials."
"Even under the study’s optimistic High Ambition Scenario, which assumes aggressive growth in capacity utilization rates and all-time-high recycling levels, the copper market will endure persistent supply deficits through most of the 2030s, including a deficit of nearly 1.6-million metric tons in 2035, much higher than any previous shortfall.
Yergin pointed out that under either scenario, there would not be enough supply to meet the demand of Net-Zero Emissions by 2050. The study also identifies eight key operational challenges that can constrain supply, ranging from infrastructure limitations, to changing tax regimes and permitting.
“This comprehensive analysis demonstrates that, even at the outer edge of what could happen in copper mining and refining operations, there would not be enough supply to meet the demands of a Net-Zero Emissions by 2050 world,” said S&P Global Market Intelligence executive director, economics and country risk Mohsen Bonakdarpour."
https://www.miningweekly.com/article/copper-shortages-to-hamper-net-zer…
Yes, I know copper didn't run out in 2020 as CoR predicted. No need to contradict yourself, I'm good. Though I do find it odd that you would cling to such a failed set of predictions and then use a greenie bat crazy net zero fantasy to try and make some kind of point. NYT 1 LMBF 0.
No - but it's down to needing 400 tons of overburden removed, where it once took 10 - to get at 1 ton of copper.
And that figure is rising exponentially.
Just as the EROEI of the oil being used to do the removing, is diminishing at an exponential rate. Those graphs are compound.
A very few years means forever, in your mind? I guess the fact that you're here at the moment, means you'll live forever?
Nuts
If you do not understand the impacts of a shortfall in critical minerals then you are beyond help...enjoy.
Logical fallacy:
Argumentum ad hominem - "poisoning the well"
religious dogma never requires facts to support their adherents "truths"
Then why do you channel priests?
Because economists - by avoiding real stock-counts (and sink-capacity counts - are nothing but priests peddling something other than truth. As are their regurgitators; politicians and the media.
Oh, and those who act as mouthpieces. Consistently. Got a mirror?
Reduction in consumption is built in - the economic headwinds you speak of are going to be lack of consumption not excess. Handwringers only need to stick to the real world of basic biology rather than delve in to non-scientific terms like "overshoot", "degrowth" mumbo jumbo.
Contrarian.
Price of gold at the moment $2999.9999 four nines purity while testing 3000.
Edit: Sorry, getting a bit too excited, sort of a big moment.
Dollar going up because of Luxon's comments re India trade? Or is it fear of Trump?
weak USD https://www.tradingview.com/symbols/TVC-DXY/?utm_source=google_ads&utm_…
Luxy doesn't move markets
Try overlaying Kraken'scomment and yours, over my initial post.
Fear is the key.
Gold is always a fear-retreat; the fact that it's climbing isn't good news, it reflects bad. So too the individual panic reactions; Gates abandoning his 'save the planet' greenwash (he may even have believed it); Musk turning his back on Tesla owner types - the problem was always that real sustainability is incompatible with endless 'economic growth', and most people have made their strategic moves/calls, in an era of 'economic growth'. Most people - from the strapped mortgage-holder of a run-down shack, to Gates/Musk - need the System to keep going, to validate their calls. And their status. And perhaps because they don't want to realise they had been on a wrong track (fear of looking stupid).
But a growing cohort realise - although the financial media are not informing them - that something is wrong. Hence Trump, hence gold. Both symptoms, not causes. And no leadership - from China to NZ - is addressing this yet (although you can sense unease in that Herald link someone put up yesterday arvo).
https://www.nzherald.co.nz/nz/politics/new-energy-minister-simon-watts-…
While the current CTA model selling is over a serious breach of 5400 will trigger more CTA and portfolio parity models will also begin to sell to rebalance. Important to get the scale of what triggers if we ratchet lower, we could easily see -20% S&P500 at 4,900-5,000 if 5,400 goes.
It always has been. And we've talked before that Americans don't seem to be able to ask why Trump. Ironic though the collapse they're pushing for will hurt them the most. Until the rest realize they want a dictatorship.
New Zealanders have an average balance of $37,079 in KiwiSaver.
Thousands of New Zealanders in the years just before retirement still have less than $10,000 in their KiwiSaver accounts, new data shows.
The Retirement Commission has released new data from actuaries MJW which shows a breakdown of KiwiSaver balance by age and gender, as at the end of last year.
It showed that overall, New Zealanders had an average balance of $37,079 in KiwiSaver, an increase of $5256 from the previous year. Men had $42,664 on average and women $34,185.
That data, which covers 97 percent of the KiwiSaver industry, shows the gender gap has remained at about 25 percent in the past two years - despite data from individual providers such as Westpac that showed progress towards reducing it.
Te Ara Ahunga Ora Retirement Commission policy lead Dr Michelle Reyers said it was concerning that the gap wasn't coming down, despite improvements in the gender pay gap.
She said the stickiness was a function of a few things, including that the pay gap only measured the difference in men and women's hourly pay rate and did not take into account the fact that one in three women were in part-time paid work, and that women were more likely to be out of the paid workforce entirely.
She said the gap could compound because people starting from a lower base would have lower returns on that initial investment.
The gap peaks at 37 percent for people aged 56 to 65, where men have about $20,000 more on average in KiwiSaver.
Among members aged 61 to 65, in the years just before they become eligible for NZ Super, 35,572 people had a balance of $10,000 or less and 65,833 had $80,000 or more.
Just over 130 people aged 17 and under had $80,000 or more in their accounts.
Reyers said older people approaching retirement with small KiwiSaver balances were probably a function of the fact that they had not had the scheme for their entire working lives.
"It's just having its 18th birthday -it probably needs to be around for another 20-odd years before we see the full impact of having the scheme available across someone's whole working life."
She said it was not clear from the data what other savings people might have, or other assets they could draw on in retirement.
"But it brings into stark relief the importance of NZ Super for people approaching retirement."
She said research had showed 40 percent of those aged over 65 relied entirely on NZ Super in retirement and 20 percent only had a bit more.
Reyers said she had hoped the average balance would be a bit higher but it was positive that the amount was increasing.
"If you look at how many people have balances below $10,000, that number is shrinking over time."
More than a third of people now have less than $10,000 invested. At the same time the number of members with balances of more than $80,000 had generally trended up over time to 12 percent of members from 8 percent in 2021.
"We had expected balances would be higher, that's one of the reasons why as part of the recommendations we put out when we released a paper last year on how KiwiSaver settings could be enhanced, we had the view that we should be increasing the contribution rate to a default 4 percent for employees and have employers pay 4 percent as well. That 8 percent is going to have a quite a big impact for a small change."
She said, with government hinting at the potential for changes to KiwiSaver settings, it seemed that things were moving in the right direction.
Average balances were highest among people aged 86 and over, with an $174,842 average overall and $206,152 for women. But that is likely influenced by the small number of people who have money in KiwiSaver after age 86. There were just 362.
"These people probably wouldn't have used KiwiSaver as an accumulation product as they would mostly have been over the age of 65 when it was first launched - we haven't done additional research into this but we suspect they are using the fund as an investment vehicle in their retirement."
Among the working age population, the largest average balance was among those aged 61 to 65.
Retirement Commissioner Jane Wrightson said changes were needed.
"KiwiSaver has been instrumental in promoting retirement savings in New Zealand, but it's not working as well as it could for everyone. Changes made to the settings now will improve outcomes for all who contribute, and since women live longer on average than men and therefore have longer retirement periods to fund, for this demographic, a rethink is especially critical."
What's the average balance for your age?
The data showed the following average balances for age groups at 31 December, 2024.
Under 17: $3286
18 to 25: $10,028
26 to 30: $19,803
31 to 35: $24,075
36 to 40: $30,437
41 to 45: $39,641
46 to 50: $50,192
51 to 55: $58,940
56 to 60: $65,006
61 to 65: $69,104
66 to 70:L $64,929
71 to 75: $66,634
76 to 80: $66,505
81 to 85: $84,876
86 and over: $174,842
Or, instead of fixating on proxy (see first post) they could grow a vege-patch, or join others in one. They could make their houses more energy-efficient (the payback is permanent) and even go shares in a future energy-source (a firewood block, for instance). And they could adopt lifestyles which demand less proxy.
The RC is a mile away from any of that - probably trained as an economist?
Surely some people have retirement savings in other "products". I read and listen to people complaining about Kiwisaver like it's their only option but occasionally others talk about only putting the minimum in for the government/employer contribution and having investments elsewhere as well.
Plus what PDK mentions too.
For sure that article does not address it, but most people contribute the 3% to get matching employer contribs. I think the general savings for most NZers is low internationally, they intend to eat their million dollar house as they get old.
If you're financially literate and have the willpower it's better to max out your employer Kiwisaver contributions (if available to you), and save all savings beyond that 3% or whatever in other cheaper investments that you have more control over. You can invest in much the same stock indexes outside of Kiwisaver, with lower fees and the flexibility to withdraw early, for example if you want to retire before 65.
Exactly. Kiwisaver was supposed to be for those who had nothing in the way of retirement savings rather than the only option for everyone.
If you're not financially literate, this very website is a good place to start on the road to said literacy.
We welcome your comments below. If you are not already registered, please register to comment
Remember we welcome robust, respectful and insightful debate. We don't welcome abusive or defamatory comments and will de-register those repeatedly making such comments. Our current comment policy is here.