
There's no question it was bad. But HOW bad?
That's what we are asking ahead of the release on Thursday, September 19, of GDP figures for the June quarter 2024.
I didn't have all the major bank economists' forecasts in front of me at time of writing this, but most estimates appear to be between -0.3% and -0.4% (although, ANZ is going for -0.1% ). The Reserve Bank (RBNZ) has forecast -0.5%.
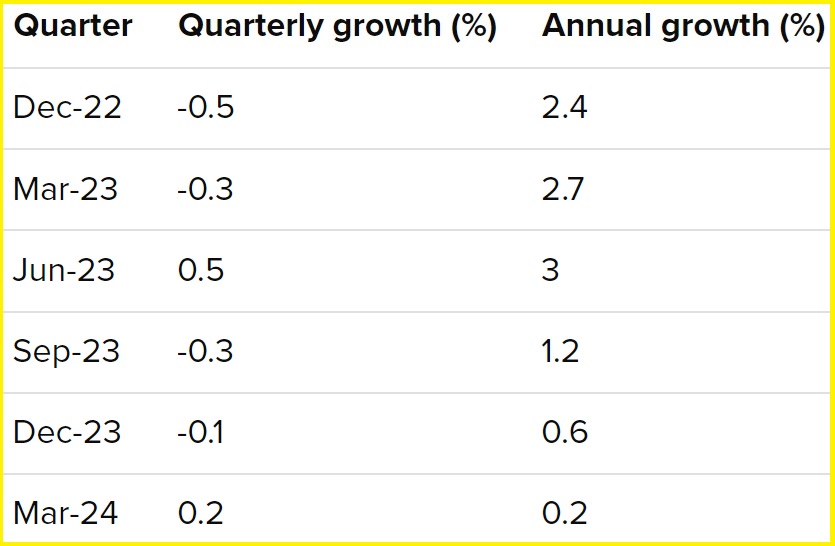
For some context, GDP figures for the past six quarters (up to March 2024) have read like this:
Well, plenty of room for improvement, isn't there?
But let's look on the bright side. At least the figure for March quarter 2024 didn't have a minus sign in front of it. And this means we are not as of now technically 'in recession'. Small consolation though. The fact is our economy's in a big hole, whether we are 'technically' in a recession or not. The past two years have really been a long rolling recession.
As can be seen from the figures above, our GDP has contracted in four of the six previous quarters. With the June quarter widely expected to have a minus in front of it, this means five out of seven quarters will have had our economy going in reverse. And just for the icing on the cake, the RBNZ is forecasting that the September quarter we are now in will also produce a negative outcome. So it might end up with us experiencing six quarters out of eight of negative GDP figures.
The current run of negative GDP outcomes can be compared to some of our more notable past economic struggles. For example:
- In the 1988-91 period we had six out of nine quarters of negative GDP, and then threw in a short, but sharp, two quarter recession in 1992 for good measure.
- During the 1997 Asian crisis we had four out of five quarters of negative GDP.
- From the start of 2008 and the Global Financial Crisis we had five consecutive quarters of negative GDP.
Even grim figures don't necessarily depict the 'true' level of grimness, however.
Arguably the most telling measure of GDP is the GDP per capita figure - namely how much each person in the country is producing.
So, how are we doing on that score at the moment? Oh, abysmally.
More hands producing less
It won't have escaped your notice that once our borders opened again after the pandemic, thousands of extra people started flooding in. What this means is that our basic GDP figures, bad as they've been, have been produced by a lot more people. Therefore they are even worse than they first look.
Already our current economic downturn is, on a per capita basis, more severe than the GFC was.
During the GFC period our per capita GDP fell 4.2%.
In the current downturn, up to and including the March 2024 quarter, our per capita GDP had fallen 4.3% (that's from the third quarter of 2022 onwards).
And regardless of how bad the 'headline' GDP figure for the June 2024 quarter proves to have been, we can say with confidence that the per capita GDP figure will have gone backwards again. So, the overall per capita GDP contraction is definitely going to end up being even worse than the 4.3% figure we currently have in front of us.
So, what can we expect in those the June quarter figures?
We can get some clues by looking at already released June quarter results from some of the key sectoral contributors to GDP - the 'partial indicators' as the economists like to call them.
The results have been pretty bad - but perhaps not quite as bad as might have been indicated other high frequency economic data.
Retail sales volumes fell by a chunky 1.2% in the June quarter, confirming what you've been able to see if you look around your local shopping centre. It's tough out there. Comparing June quarter 2024 with June quarter 2023, sales volumes were down some 3.6%.
The volume of building work put in place fell by 0.2%, although that was a smaller fall than some economists had expected. Nevertheless, it was the lowest volume of building work seen in a June quarter since the Covid-affected June 2020 quarter.
The volume of total manufacturing sales rose by a surprisingly strong 0.6% after three consecutive quarterly falls. Wholesale trade sales, however, fell on a seasonally adjusted basis by 1.1% in the June quarter.
What's it all mean then? Well, that overall picture highlighted above doesn't look great. But as stated above, these June quarter figures are now already vaguely historic. The fact that they will be some kind of bad really doesn't have much impact now.
The bottom of the cycle?
The RBNZ's decision to cut the Official Cash Rate in August from 5.5% to 5.25%, with more cuts likely to follow in short order gives good reason to think this might well be the bottom of the cycle.
The June quarter GDP figures are not likely to have an impact on the RBNZ. The only vague possibility of some impact would be if the fall in GDP was to be bigger than the 0.5% the RBNZ's forecasting. If the economic situation was looking REALLY dark then our central bank might consider doing a double-cut (50 basis points) to the OCR.
Indeed the financial markets ARE still pricing in a double cut before the end of this year, but I tend to think that's the markets getting ahead of themselves.
What we'll be mostly looking for from the June GDP figures are signs that the bottom has been reached and that maybe we can draw some positives and encouragement that the future is now looking 'less bad'.
But less bad doesn't immediately become good.
As said further up the article, the RBNZ is currently forecasting that the September quarter we are now in will also see the economy shrink.
It could be that the August OCR cut, with promise of more cuts to come, may just turn things around enough for GDP to creep positive for the current quarter.
Realistically though, regardless of whether the September quarter sees a plus or minus GDP figure, it's difficult to see the economy getting much momentum until into 2025.
Much will depend on how quickly there is a positive reaction from businesses and individuals to the encouragement of lower interest rates. Early signs have been good. We saw a big bounce in business confidence in the latest ANZ Business Outlook survey.
However, to express confidence through a survey is one thing. The real test is whether such confidence is backed up with actions.
Economic growth
Select chart tabs
*This article was first published in our email for paying subscribers early on Friday morning. See here for more details and how to subscribe.
We welcome your comments below. If you are not already registered, please register to comment
Remember we welcome robust, respectful and insightful debate. We don't welcome abusive or defamatory comments and will de-register those repeatedly making such comments. Our current comment policy is here.