
By Patrick McGuire & Goetz von Peter*
Tracking the size of carry trades and the entities involved is notoriously difficult. While Bank for International Settlements (BIS) statistics record total amounts of yen borrowed from banks or via foreign exchange (FX) derivatives, they do not reveal specific uses – the carry trade being just one of many.
This article explains how these statistics can provide some rough indicators of carry trade activity. The figures should be interpreted with care given data gaps and the assumptions used.
A carry trade is a leveraged cross-currency position designed to take advantage of interest rate differentials and low volatility. The strategy involves borrowing funds at a low interest rate in one currency (the funding currency) and buying a higher-yielding asset in another (the target currency). In recent years, low interest rates for the Japanese yen relative to other currencies have made the yen a funding currency of choice. The use of leverage makes these positions sensitive to changes in exchange rates, interest rates and volatility.
There are several ways to implement a carry trade, each with different implications for what can be seen in international statistics. The textbook case involves borrowing the funding currency, selling it spot and investing the proceeds in an asset denominated in the target currency. This is recorded as debt (eg bank loans) owed in the funding currency.
The more common approach used by hedge funds and other speculators relies on derivatives – eg FX forwards, swaps and options – to establish an open forward payment obligation in the funding currency. An outright forward position to deliver yen at maturity is a bet on yen depreciation. Borrowing yen in an FX swap to sell yen spot is an attractive alternative, given the depth of FX swap markets. Since the use of derivatives requires no on-balance sheet borrowing of the funding currency, it is difficult to trace the trade in the statistics.
Despite these limitations, the BIS international banking statistics (IBS) and over-the-counter (OTC) derivatives statistics shed some indirect light on carry trade activity. This is because they provide a currency breakdown of banks' on-balance sheet positions and of outstanding amounts in FX derivatives markets, respectively. Consider on- and off-balance sheet yen borrowing in turn.
The IBS show a sustained rise in on-balance sheet yen borrowing over the past few years, an increase that may – but need not – be linked to carry trades. Banks' yen-denominated claims – which include loans, holdings of debt securities and derivatives with a positive market value – on non-banks resident outside of Japan reached $880 billion, or ¥133 trillion, in the first quarter (Q1) 2024 (up from ¥110 trillion in Q4 2021).
The bulk of these claims are on borrowers in the Cayman Islands, mainly non-bank financial institutions (NBFIs). Special purpose vehicles located there issue debt securities purchased mainly by banks located in Japan. Such financing structures, however, have been in place for decades and have shown modest growth of late, so that they may not be related to speculative carry trade positions.
Banks' yen-denominated loans to non-banks outside of Japan have grown noticeably, in particular since mid-2021. Outstanding amounts rose from $228 billion (¥25 trillion) in Q2 2021 to $271 billion (¥41 trillion) in the most recent data for Q1 2024. (The depreciation of the yen between then and Q2 2024 would put that value at roughly $250 billion.) These loans were mainly to borrowers located in the United Kingdom, the Cayman Islands and the United States. Without more detailed data, however, it remains unclear whether this relates to carry trades.
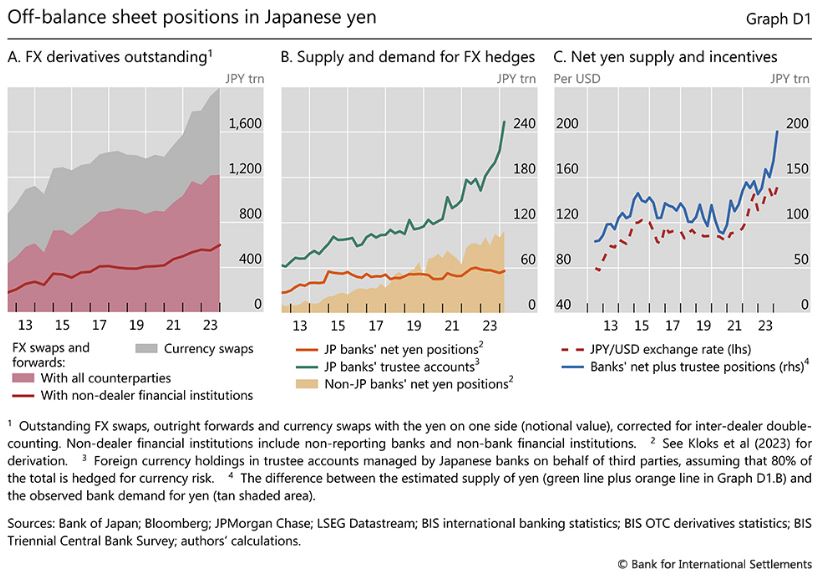
What about information gleaned from the BIS derivatives statistics, the instrument more likely to be involved in carry trades? These statistics show that the notional value of outstanding FX swaps, forwards and currency swaps with the yen on one side has grown to $14.2 trillion (¥1,994 trillion) by end-2023, up 27% in yen terms since end-2021.
FX swaps and outright forwards drove this growth (red shaded area). The bulk of these are used for hedging and liquidity management, but they can also be used for speculative purposes. While nearly half of the outstanding FX swaps and outright forwards are with "non-dealer financial institutions" (red line), which includes non-reporting banks and NBFIs, the share specifically related to speculative activity is likely to be much lower. For example, using counterparty turnover data, estimate hedge fund FX forward positions to have been about $160 billion.
An alternative approach to assessing carry trades via FX derivatives is based on the IBS, which provide an indirect and incomplete view of positioning in the markets for FX derivatives. These statistics track banks' net on-balance sheet positions in major currencies, which in turn reveal their net positions in FX derivatives under the assumption that they do not run large open currency positions.
This is a reasonable assumption because of supervisory guidance. If so, any open on-balance sheet position must be offset by a corresponding off-balance sheet position. For example, a bank with a yen funding base can exchange yen for dollars via an FX swap to purchase a dollar asset; the offsetting on- and off-balance sheet positions shield the bank from exchange rate movements for the duration of the FX swap since the exchange rate at which it is unwound is set in advance. Currency mismatches in banks' on-balance sheet positions are thus indicative of their (unobserved) net positions in FX derivatives.
To a large extent, banks from different currency areas offset each other's FX derivatives positions. For example, Japanese banks are natural suppliers of yen via FX derivatives: they have a domestic yen deposit base but hold portfolios of foreign currency assets and use FX swaps to hedge the currency risk. Non-Japanese banks in turn absorb much of this supply by providing dollars and other currencies in exchange for yen via FX derivatives.
They do so to hedge their own yen-denominated asset portfolios and, since the Great Financial Crisis, to take advantage of the cross-currency basis trade. Their net yen assets, and hence their estimated net yen borrowing via FX derivatives, has grown threefold since 2017, surpassing the net supply of yen from Japanese banks (shaded area minus orange line).
Non-banks also use FX derivatives, but here the picture provided by the IBS is far less complete. These statistics capture only the assets in "trustee accounts" managed by Japanese banks on behalf of third-party investors (ie not on Japanese banks' balance sheets); they do not capture those of other non-banks around the world.
Even so, assets in these trustee accounts, which totalled $2.7 trillion at end-Q1 2024, imply a supply of yen in FX derivatives when they are hedged for currency risk. More than three quarters of the total amount is denominated in currencies other than the yen, and the bulk is likely to be in debt instruments.
Assuming 80% of these holdings are hedged for currency risk, an estimate of the supply of yen via FX derivatives reached $1.7 trillion (¥254 trillion) at end-Q1 2024. If only 60% were hedged, the amount would fall to near $1.3 trillion (¥190 trillion). Other institutional investors in Japan that hold foreign currency asset portfolios on a (partially) hedged basis would add to the supply of yen in FX derivatives, as would corporates outside of Japan that issue yen-denominated bonds on a hedged basis. Unfortunately, these positions are not observable in BIS statistics.
Combining the observable elements – the trustee positions and banks' own use of FX derivatives – yields a time-varying, albeit incomplete, measure of the net supply of yen available for other players in the FX derivatives market. The blue line in Graph D1 above is the difference between the estimated supply of yen (green line plus orange line in Graph D1 and the observed bank demand for yen (tan shaded area).
Market clearing requires that other, unobserved non-bank market participants absorb this supply. These could include institutional investors outside Japan that hold yen-denominated assets on a hedged basis as well as speculative investors seeking to engage in carry trades by borrowing yen. If the latter transaction involves a subsequent spot sale of yen, to bet on yen depreciation, it can put downward pressure on the currency.
The co-movement between the measure of net yen supply and the USD-JPY exchange rate suggests that speculative investors may indeed have been involved. The measure rose by ¥66 trillion between end-2021 and Q1 2024, or $435 billion at Q1 2024 exchange rates, coinciding with a significant depreciation of the yen (red-dashed line) and rising incentives for engaging in carry trades.
The IBS alone reveal little more than an indirect picture of the global dealer banks that sit between the various types of non-banks with positions in FX derivatives. Better data on the users of FX derivatives and their positioning in these markets are needed for a more complete picture. To this end, the BIS is working with the Committee on the Global Financial System to enhance the OTC derivatives statistics. Such data would complement other market indicators and flow data in the monitoring of carry trades.
*Patrick McGuire is Head of International Banking and Financial Statistics and Deputy Head of Statistics and Research Support at the Bank for International Settlements (BIS). Goetz von Peter is Deputy Head of International Banking and Financial Statistics at the (BIS). This article comes from the BIS Quarterly Review for September 2024 and is used with permission.
The views expressed are those of the authors and do not necessarily reflect the views of the BIS.
We welcome your comments below. If you are not already registered, please register to comment
Remember we welcome robust, respectful and insightful debate. We don't welcome abusive or defamatory comments and will de-register those repeatedly making such comments. Our current comment policy is here.