

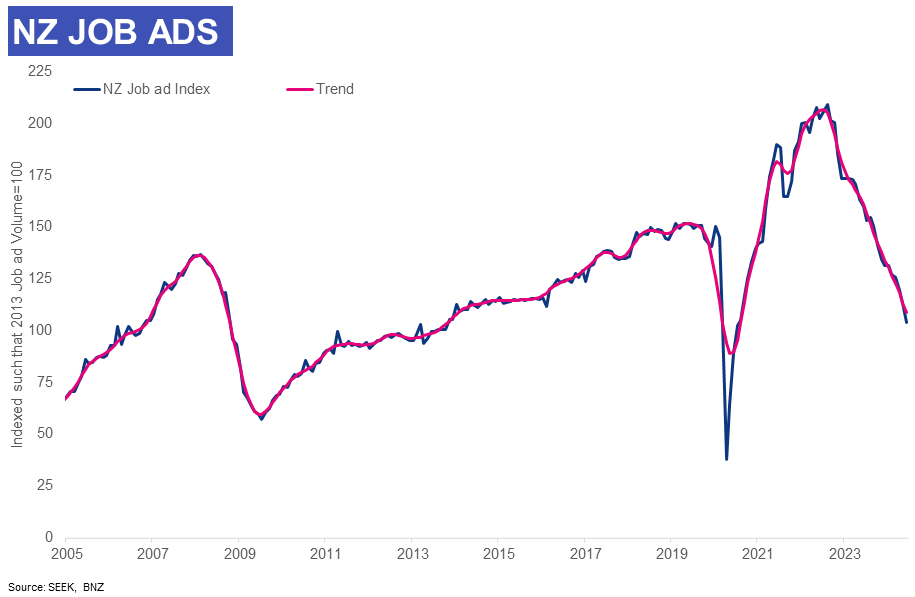
Job ads have dropped to their lowest level since October 2013 - excluding the volatile pandemic lockdown period, according to the latest BNZ/SEEK Employment Report.
BNZ's Chief Economist Mike Jones says labour demand is “withering” and job ads have been on a declining trend since late 2022.
Job ads dropped by 8.2% in June, the steepest monthly fall since the lockdown-affected August 2021 and the fifth month in a row of job ad declines.
Seek had reported last month that job advertisements had fallen 5% in May.
“Falling job ads are symptomatic of ailing demand for labour, a trend that is increasingly turning up in other indicators,” Jones says.
“This slowing in demand, alongside ample labour supply, saw the number of job applications per ad rise to a fresh high in May.”
Jones says currently, this ratio is 57% higher compared to this time last year, which suggests “additional increases” in the unemployment rate.
In the March quarter, the unemployment rate rose from 4% to 4.3%.
The figures from Statistics NZ showed that the labour market was weakening at a faster rate than expected by the Reserve Bank (RBNZ) and some bank economists.
The unemployment rate for the June quarter will be released on August 7.
According to the BNZ/SEEK Employment Report, the decline in job ads during June was spread across nearly all industries.
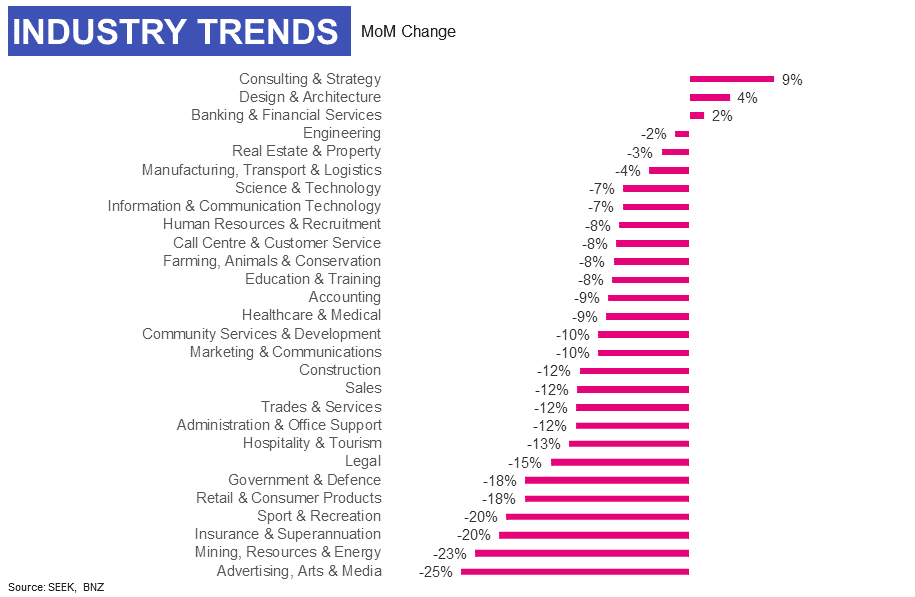
Job ads related to Consulting & Strategy were up 9% month on month as were job ads in Design & Architecture which reported a 4% increase.
But Jones says these looked to be a correction from “outsized declines the previous month” as those same two industries recorded the largest declines in May.
Over the last 12 months, the job ads that have fallen back the most were Government & Defence (down 59%), Construction (down 50%), and Consulting & Strategy (down 48%).
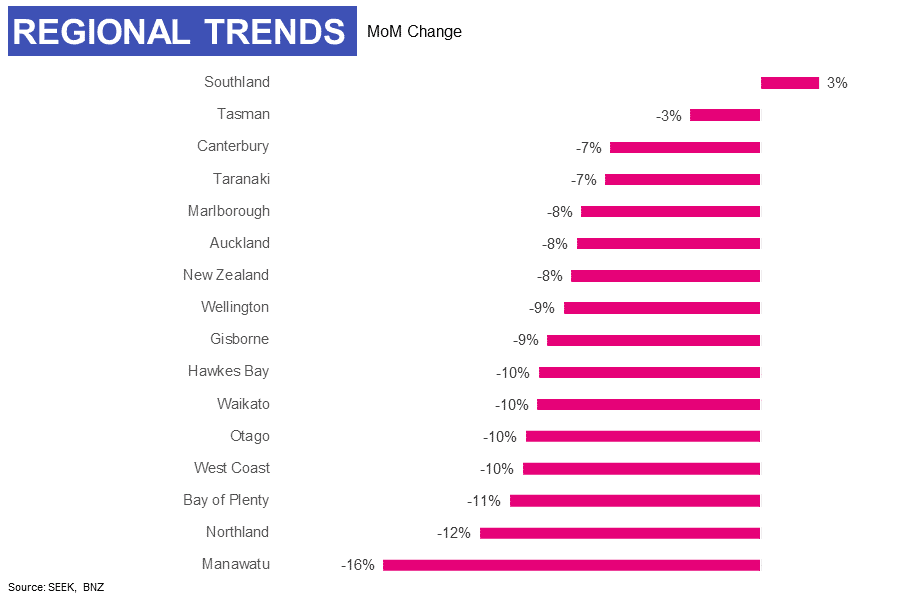
In terms of region, Wellington and Marlborough were the regions hardest hit by job ad decline over the past year.
“The relatively larger declines in job ads associated with the government sector show up in the regional data,” Jones says.
Job ads in Wellington have fallen 46% compared to 12 months ago and job ads in Marlborough have fallen 50% in the same period.
The regions to see the smallest job ad declines are Taranaki, which reported job ads falling 28% in the last year and Otago decreasing by 24%.
21 Comments
Gosh, this is happening quickly.
I think economy is way sicker then the RBNZ will admit at 2pm
Another dose of this, no doubt: "The Committee agreed that monetary policy needs to remain restrictive to ensure inflation returns to target within a reasonable timeframe."
Data from the Ministry of Social Development shows that there were 13,668 more people on Jobseeker Work Ready in May than a year earlier, an increase of 14 percent. Another 2052 went on to the benefit in the month of May alone.
Since then, weekly reporting data shows another 2450 signed up to the benefit through June.
And that's just the ones who:
1./ Are able to access the benefit due to having low savings
2./ Haven't let pride get in the way of having an income to pay the bills
There's still many out there eligible for the benefit who haven't applied, or are living on savings or their partners income.
The increase in demand for "consulting and strategy" are probably HR consultants for thinning out the herds.
Or public servants being re-hired as contractors
Liquidators must be busy
They are.
And accountants that specialize in pre-cleanups.
We are going to make 2008 look like a walk in the park.
Was talking to one today who happens to be a friend and he’s been swamped for months and now just turning people away.
Can’t keep up.
What does this comment mean? Swamped with what? Who is he turning away and why?
What has Orr and his merry group of followers misread the room yet again. make sure you buy Grant a birthday present for that new contract he gave you before he was outed.
50k businesses that employ between 6-49 staff = +700k jobs. Those businesses are funded by their owners. Often using borrowing against property which is adversely effected by interest rate rises. In order to service their debt they have to trim staff costs or risk losing their property assets. Your job or their house. It's an easy decision for them to make.
You are so right and this sector is overlooked by the media.
This is why banks are calling for cuts. They know what decisions their clients are making.
Advertised for a driver last week, light truck/large regional city. Got 230 applications.
https://i.ibb.co/n0VgZqn/mei-climatemap-may2024.png
The link above is a little table that I use to track the state of the labour market using the Monthly Employment Indicators. Each row is an industry and each cell is the number of jobs that industry has added in the last year. The rows are in descending order, so top row is the industry that added the most jobs in the last year, bottom row the least etc.
Anyway, by eyeballing the colours you can see the 'cyclical waves' roll through the economy - lots of red = hot market, lots of blue = cool market. Two things to note about the most recent month: 1) the median industry had added essentially zero jobs in the last year and 2) most of the job growth has be concentrated in the top three industries: Health Care, Education, and Public Administration. Health Care alone has added 14.5k and everything else combined has only added 7k.
It is not looking good.
The current trajectory of the BNZ/Seek NZ Job Ads graph (above) follows almost exactly the crash in job ads shown for the earlier period 2009-2010. This culminated in an unemployment rate of 6.6% in June 2010.
Heaven help us if we continue heading towards that low point. The human toll was tragic.
Unfortunately I see nothing on the economic horizon to turn that trend around.
Remember through the 20-teens we had earthquake stimulus and aggressive Reserve Bank cuts.
It is worthwhile to recall how long it took employment to climb out of that hole.
Unemployment %
Jun-10 6.6
Jun-11 6.1
Jun-12 6.4
Jun-13 6.0
Jun-14 5.3
Jun-15 5.5
Jun-16 5.1
Jun-18 4.6
Jun-19 4.1
Source: Stats NZ graph of unemployment 2020 to current:
https://www.stats.govt.nz/information-releases/labour-market-statistics…
It is really really bad for everyone.
seek stopped putting the number of people that applied for a job when it went over 100.
I expect massive job losses / business failures as the people keeping their businesses going from savings run out.
We welcome your comments below. If you are not already registered, please register to comment
Remember we welcome robust, respectful and insightful debate. We don't welcome abusive or defamatory comments and will de-register those repeatedly making such comments. Our current comment policy is here.