

The OECD's 6th edition of corporate tax statistics released late last week has a wealth of interesting data. This is now an annual publication which pulls together a whole heap of information on corporate taxation and what's happening with the Base Erosion and Profit Shifting (BEPS) initiative.
The aim is to develop a corporate tax database which is going to be available to tax policy researchers and policy makers about corporate tax rates, effective tax rates, tax incentives for research and development and other topics such as withholding taxes. Increasingly, the amount of information includes anonymised and aggregated country by country reporting data, which provides an overview of the global tax and economic activities of thousands of large multinational enterprises operating worldwide. This year's report covers 8000 such enterprises.
The detailed statistics in the report are mostly from the 2021 calendar year although some 2022 data is included. The report does take into account the statutory tax rates currently in force.
Increased country by country reporting and more reporting generally is part of the 15 actions within BEPS. The report sets out why this is important:
“Action 11 noted the lack of available and high-quality data on corporate taxation is a major limitation to the measurement and monitoring of the scale of BEPS and the impact of the measures agreed to be implemented under the OECD/G20 BEPS Project.”
Corporate tax rates are stabilising
The headline summary is that corporate tax revenues remain important, but statutory corporate tax rates as the report are now showing signs of having stabilised after pretty near two decades of decline. During the period between 2000 and 2024 the average statutory tax rate declined from about 28% in 2000 to 21.7% in 2019. However, between 2019 and through to 2024, it has remained relatively stable at a rate of 21.7% in 2019 and 21.1% in 2024. I think stabilisation is a trend that's going to continue.
Who knows, though, if the possible re-election of Donald Trump may change this. But I think governments balance sheets worldwide have been weakened considerably by the double whammy of the Global Financial Crisis and then the pandemic. I therefore think the opportunities to actually cut corporate tax rates further are quite limited, but we shall see.
Just to put New Zealand in context, back in 2000, our corporate tax rate was 33%. With effect from 1st April 2008, it was reduced to 30% and then on 1st April 2011 it was reduced to its current level of 28%. Across the ditch Australia has had a 30% corporate tax rate since 2001.
There's interesting data about the importance of the corporate tax take. On average for the 2021 year, which was also a pandemic affected year, corporate tax revenue represented 16% of all tax revenues. New Zealand is in line with that average, but as a percentage of GDP, the OECD average was 3.3% whereas here it was considerably higher at 5.7%.
The report also considers effective average tax rates (EATRs) and examines the effect of tax incentives such as more generous tax depreciation compared with true economic deprecation. Again, according to the report effective average tax rates have remained relatively stable falling slightly from 20.9% in 2019 to 20.2% in 2023. Median effective average tax rates were 22.8% in 2019 and practically unchanged at 22.7% in 2023. Meanwhile, New Zealand’s effective marginal effective average tax rate is still relatively close to our statutory tax rate of 28%.
But…a narrowing tax base?
Chapter 4 of the report discusses effective and marginal tax rates and has some interesting commentary around declines of effective marginal tax rates (EMTRs). The report notes
“The stability of EATRs combined with declines in EMTRs suggests a narrowing of tax bases in the sample, notably through an increase in the generosity of depreciation provisions. Examining the asset breakdown shows these trends have been driven by increased generosity of depreciation of tangible and intangible assets, as opposed to buildings and inventories.”
I think some of this might be part of the response to the pandemic. New Zealand is noted being alongside Argentina, Japan, Papua New Guinea and Peru as having a higher effective marginal tax rate because we've got less generous depreciation rules. (This has become more so with the imminent withdrawal of building depreciation).
Research and development incentives
Chapter 5 looks at tax incentives for research and development, noting that they've become more generous over the past 20 years or so. 33 out of 38 OECD jurisdictions offer tax relief from R&D expenditures in 2023, compared with 19 in 2000. New Zealand is one of the new jurisdictions now offering R&D incentives. These are becoming more generous over time.
From a New Zealand perspective, we discuss the importance of R&D in boosting our productivity and we still could do more in that space. I'm inclined to the view I heard recently expressed that it's better to give a tax incentive for it rather than get involved in the grant process. Because with a grant process, the companies can be restrained in what they have to spend because of the application process. Also, there's a lot of effort involved with applying grants, less so with an R&D tax incentive, subject to Inland Revenue monitoring.
According to the report the level of direct government funding and tax support for business R&D in 2021 was about .12% of GDP, well below the OECD average of .2 of GDP. So, there's still room for improvement although that's something that's been acknowledged across the board.
Chapter 6 looks at BEPS actions and notes that there's a large number of controlled foreign corporation or control foreign company rules with apparently 53 jurisdictions having it in place in 2024. There's also growth in the use of interest limitation rules. This is part of a growing trend in tax policy around the world to consider imposing restrictions on the deductibility of interest. Apparently, there are now over 100 interest limitation rules in place up from 67 jurisdictions back in 2019.
The dangers of following Ireland’s example
Chapter 7 has a breakdown of country by country reporting statistics with 52 jurisdictions out of a possible 101 submitting statistics to the OECD. As I mentioned earlier, this report includes the activities of over 8000 multinationals so there's a lot of detail in here.
Several commentators including the New Zealand Initiative have recently mentioned Ireland as a potential model to follow. As is well known, Ireland has a very low corporate tax rate. I was therefore very intrigued by figure 7.2 on page 81 of the report, which illustrates the multinational enterprises contribution to local corporate income tax revenues in 2020.
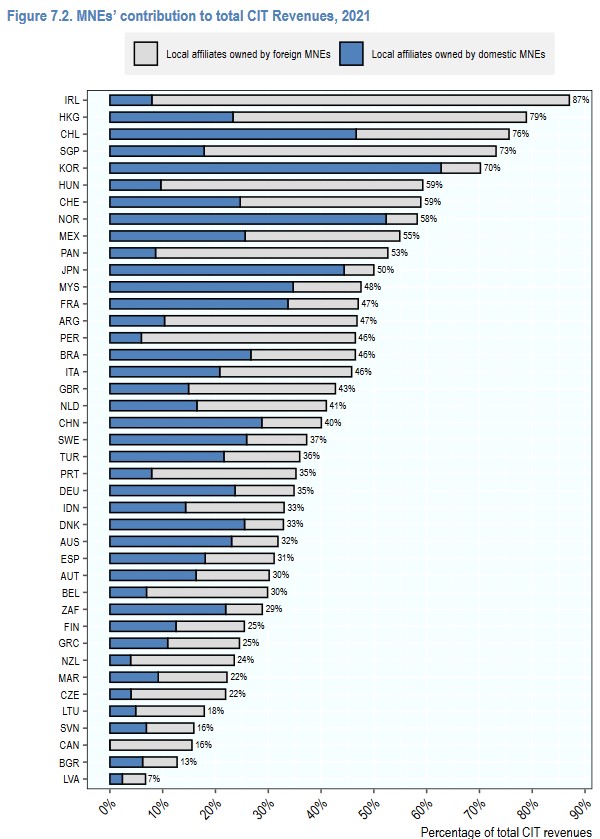
As can be seen, 87% of Ireland’s corporate tax came from multinationals, and the vast majority of those multinationals were local affiliates owned by foreign multinationals. In fact, the Irish Treasury and the European Commission have expressed concern about the sustainability of Ireland’s corporate tax revenue because of the dependency on a few large multinationals.
New Zealand is near the opposite end of the scale with only 24% of corporate tax revenue coming from multinationals, probably three-quarters of which look to be from overseas owned. I think this is an extremely interesting stat which makes me wonder about whether New Zealand is attracting enough investment and whether we should have more multinationals of our own based overseas.
Yes, but is BEPS working?
In summarising key insights on BEPS from the Country by Country Report data the report makes this observation”
“There is evidence of misalignment between the location where profits are reported and the location where economic activities occur. The data show continuing differences in the distribution across jurisdiction groups of employees, tangible assets, and profits.” [page 87]
In other words, the report is basically saying there appears to be some profit shifting going on, but we don't quite know enough about it. This gets to the heart of the idea behind the BEPS initiative, find out more about what’s happening and then fix it.
As I said the OECD's corporate database is constantly being expanded so if you're a bit of a stats guru there’s plenty to dive into and research. Overall, another interesting report highlighting how New Zealand’s corporate tax rate is at the higher end, but noting it also raises a lot of revenue relative to other jurisdictions.
Is that asset depreciable?
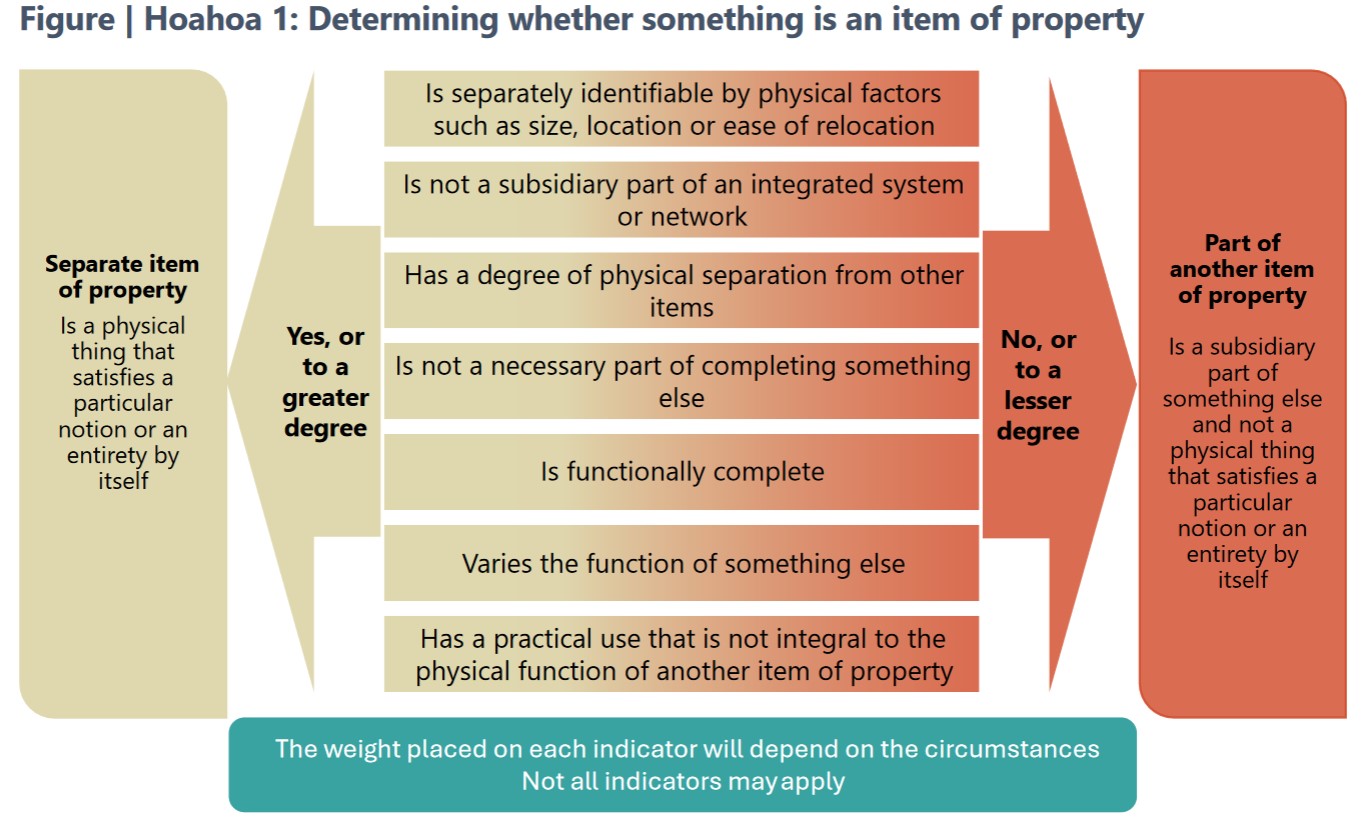
Moving on and picking up on depreciation one of the issues covered by the OECD stats, Inland Revenue has just released a draft interpretation statement for comment on identifying the relative relevant item or property for depreciation purposes. This is quite important because our depreciation regime is extremely detailed with a myriad of available rates across several categories.
This draft ties into several other related items of guidance such as residential rental properties depreciation, the question of deductibility of repairs and maintenance – if expenses are not deductible are they depreciable instead? There’s also QB 20/01 - can owners of existing residential parental properties claim deductions for costs incurred to meet healthy home standards? And finally, Interpretation Statement IS 22/04 relating to claiming depreciation on buildings. The imminent withdrawal (again) of building depreciation makes it very important now to maximise depreciation and to identify whether in fact that asset is part of the building or can be claimed separately. This draft is therefore pretty relevant.
The draft runs to 40 pages the last 15 or so pages of which are examples. There’s also a useful 6 page fact sheet accompanying it. Submissions are open until 29th August.
A post-hibernation bear is hungry…
Finally, as we discussed last week, one of the things that came out of Inland Revenue’s recent performance improvement review was for it to be more prominent in promoting what actions it has taken against non-compliant taxpayers. We're seeing more of that this week when Inland Revenue was announced that an Auckland couple have been sentenced to three years in prison on tax evasion charges. The pair committed 69 tax related offences involving income tax and GST evasion amounting to about $750,000, together with another $80,000 in unaccounted for PAYE. The judge described it as very deliberate offending including deliberate under reporting of business income filing false returns, and even failing to file false returns once under investigation. The couple withheld information from their accountants and concealed the existence of what were described as “highly relevant bank accounts.” So pretty clear case here of tax evasion.
One thing of note that does slightly concern me is this offending occurred over a six year period between 2010 and 2015. That's quite some time ago and I think Inland Revenue is much more on the case now. Even so you would hope that it doesn't take 7-8 years or more to bring people to justice on this in the future.
The taxman cometh…
For an idea of how Inland Revenue’s increased activities might play out for your average person, this week’s episode of RNZ’s podcast The Detail discussed how Inland Revenue plans to utilise its additional funding. The episode focuses on the construction industry because of the sector’s long association with the proliferation of the "cashie". Inland Revenue apparently gets 7,000 anonymous tip offs a year, many of which relate to tradies.
There’s some very interesting commentary from Malcolm Fleming, the New Zealand Certified Builders Association chief executive. He rightly points the finger back at the public for this issue. As he notes, nobody asks their accountant or lawyer ‘Well, how much is it for cash?’ On the other hand, the public seems to be happy to try this tactic with builders and others in the construction industry. On the question of tax evasion and cashies, maybe quite a few people should be looking in the mirror about that rather than pointing the finger elsewhere. It’s a very valid point.
The episode is well worth a listen; it highlights more of what Inland Revenue is currently doing. It’s now doing unannounced site visits to construction sites, for example, which I'm sure would alarm some businesses. But to be fair it also points out most small businesses are run on the straight and narrow. They are perhaps poorly capitalised with overworked owners who are also the main administrator. In many cases the question of tax arrears is more one of poor administration rather than in the case of the couple who were jailed, deliberate malfeasance.
And on that note, that's all for this week, I’m Terry Baucher and you can find this podcast on my website www.baucher.tax or wherever you get your podcasts. Thank you for listening and please send me your feedback and tell your friends and clients. Until next time, kia pai to rā. Have a great day.
We welcome your comments below. If you are not already registered, please register to comment
Remember we welcome robust, respectful and insightful debate. We don't welcome abusive or defamatory comments and will de-register those repeatedly making such comments. Our current comment policy is here.