

There was a drop in the number of properties offered at auction over the last week, suggesting auction activity may already have peaked for the year.
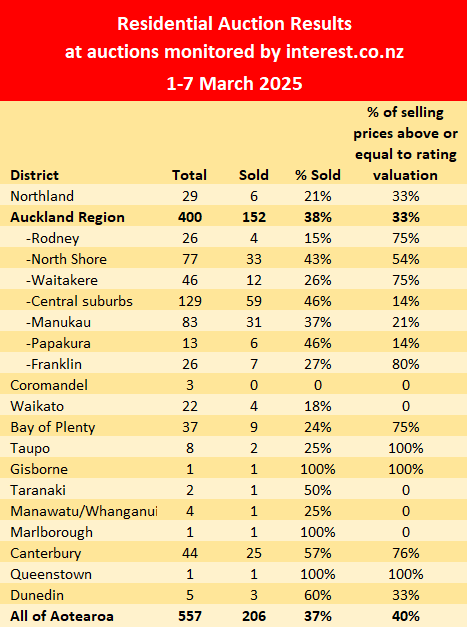
Interest.co.nz monitored the auctions of 557 residential properties around the country over the week of 1-7 March, down from 601 the previous week.
That would make the last week of February the busiest so far this year for auction activity, which would not be a surprise.
The last week of February was also the busiest week of the year in the auction rooms last year.
However, even if the peak in activity has passed, anything over 500 in a week is still a lot properties going under the hammer and the market remains extremely busy.
And while fewer properties were on offer there was no movement in the sales rate, with 206 properties selling under the hammer at the latest auctions, giving an overall sales rate of 37%, unchanged from the previous week.
Details of the individual properties offered at all of the auctions monitored by interest.co.nz, including the selling prices of those that sold, are available on our Residential Auction Results page.
The comment stream on this story is now closed.
13 Comments
So the peak has passed, it's downhill from here.. sales and prices..
Record listings . Less then record buyers.
and then there is the pesky law of
Supply and Demand
The peak was in 2021, it has well and truely passed HO.
Peak auction activity generally occurs in March, it would be unusual for it to have passed already, even though numbers were down last week.
Looking at last year’s numbers, there were more properties offered at auction in March.
But February had the better sales rate
I would expect higher numbers in March. Longer month. Less public holidays etc. Then there is whatever the Orange Swan brings....
What clearance rate do you need to see for prices to go up? In this 28-44% range, prices have been going down.
315, 131, 42%, 44% : 27 Jan - 2 Feb 2024
291, 102, 35%, 39% : 3-9 Feb 2024
449, 167, 37%, 45% : 10-16 Feb 2024
491, 154, 31%, 42% : 17-23 Feb 2024
619, 212, 34%, 38% : 24 Feb - 1 Mar 2024
573, 190, 33%, 43% : 2-8 Mar 2024
568, 183, 32%, 42% : 16-22 Mar 2024
527, 147, 28%, 34% : 23-29 Mar 2024
303, 91, 30%, 41% : 30 Mar - 5 Apr 2024
472, 132, 28%, 32% : 6-12 Apr 2024
345, 197, 31%, 36% : 13-19 Apr 2024
364, 106, 29%, 44% : 20-26 Apr 2024
437, 136, 31%, 30% : 27 Apr - 3 May 2024
315, 94, 30%, 43% : 11-17 May 2024
375, 113, 30%, 39% : 18-24 May 2024
339, 110, 32%, 35% : 25-31 May 2024
255, 82, 32%, 30% : 1-7 Jun 2024
301, 99, 33%, 34% : 8-14 Jun 2024
282, 83, 29%, 35% : 15-21 Jun 2024
236, 78, 33%, 36% : 22-28 Jun 2024
348, 99, 28%, 34% : 29 Jun - 5 Jul 2024
304, 94, 31%, 28% : 6-12 Jul 2024
212, 66, 31%, 32% : 13-19 Jul 2024
265, 90, 34%, 37% : 20-26 Jul 2024
237, 94, 40%, 28% : 27 Jul - 2 Aug 2024
267, 95, 36%, 35% : 3-9 Aug 2024
255, 104, 41%, 35% : 24-30 Aug 2024
247, 88, 36%, 29% : 31 Aug - 6 Sep 2024
230, 94, 41%, 47% : 7-13 Sep 2024
320, 139, 43%, 36% : 14-20 Sep 2024
356, 141, 40%, 35% : 21-27 Sep 2024
343, 151, 44%, 45% : 28 Sep - 4 Oct 2024
289, 119, 41%, 45% : 5-11 Oct 2024
340, 121, 36%, 39% : 12-18 Oct 2024
438, 192, 44%, 31% : 19-25 Oct 2024
428, 188, 44%, 43% : 26 Oct - 1 Nov 2024
457, 193, 42%, 42% : 2-8 Nov 2024
517, 182, 35%, 37% : 16-22 Nov 2024
497, 182, 37%, 38% : 30 Nov - 6 Dec 2024
431, 175, 41%, 46% : 7-13 Dec 2024
422, 162, 38%, 39% : 8-14 Feb 2025
496, 201, 41%, 42% : 15-21 Feb 2025
601, 222, 37%, 34% : 22-28 Feb 2025
557, 206, 37%, 40% : 1-7 Mar 2025
Clearance rates for auctions have rarely been higher than 50% in New Zealand. Only during the crazy COVID times did they see Sydney levels of clearance. As your list shows, these clearances are quite normal. Properties simply go on to be sold by negotiation with conditions.
The clearance rate must be some kind of indicator, the spruikers were celebrating the other week when it reached 41%.
The only truth is the tape young trader, prices paid.
You must have to have some difficult conversations with the wife.
Suggest that next summer you may well find a bargain, what sort of property you after? ie more land less house , are school zones important etc etc?
Your suggestion from a few weeks ago, a house that needs work on a big section. I’m also in Rodney. There's a lot just sitting and not moving above 950k. If those listings drop another 10%, we should have a lot to choose from. Maybe after July, we'll start to "spray and walk away".
A home in this area sold for 350k in Dec 2009 (3 bed, 1 bath) and then sold for 960k in November 2021, that’s a 610k increase over 624 weeks, or about 1k a week for 12 years. If it sold today, I think it would go for around 780k, which is what it sold for in March 2018, 180k below its peak. It's been 170 weeks since November 2021, so that's roughly a 1k a week drop.
It’s tempting to move to Tauranga and be mortgage free. If it weren’t for family and work in Auckland, we would do it.
Wellington housing market downturn hits Northland suburb hard as prices plummet
By Susan Edmunds of RNZ
New Zealand’s housing market downturn has hit Wellington hard – and one suburb of Wellington in particular.
Data from CoreLogic shows values in the Wellington suburb of Northland have fallen from a peak of a median $1.42 million in December 2021 to $985,000 at the end of February. That’s a 30.6% drop.
Head of research Nick Goodall said suburbs across the Wellington region dominated the list of the biggest value falls from the peak of this cycle to the trough.
He said the drop in the Northland suburb and Wellington more generally was reflective of the extreme growth seen in the Covid period across much of the country, driven by cheap and available credit.
That growth did not hold up once interest rates started to increase. The housing market then struggled further recently when the economy softened and unemployment started to rise.
“Perhaps it shows the values being paid for properties there were well above true value, driven more by FOMO and a desire to get into the market at all costs, but that’s a bit speculative on my part.”
Property investor Steve Goodey said Northland had “boomed hard” during the market peak. “It’s very close to the Kelburn campus for Victoria University and international students just haven’t come back in the numbers we had before.”
He said that could put rent under pressure.
Brad Olsen, principal economist at Infometrics, said Wellington in general had dealt with a number of factors that had hit its housing market hard.
The economic environment was challenging, and a housing shortage in previous years had helped drive up prices, which then fell when people could no longer afford to pay them.
Some buyers were opting to move further out of town, which also reduced demand for more central suburbs such as Northland, he said.
Wellington had some of the lowest population growth last year, at 0.2%, but Northland itself had been flat and had lost more population than it gained over the past four years. It might also have been a popular spot for public sector workers who have faced job insecurity.
CoreLogic’s data for February showed Kāpiti Coast prices up 0.3% for the month, Porirua flat, Upper Hutt up 0.5%, Lower Hutt up 0.4% and the central Wellington area flat.
“Wellington still faces some economic challenges in the near term, given the restraint on public sector expenditure. But housing affordability across the capital is far less stretched than it was two to three years ago, which is likely to have played a role in helping bring some buyers back to the table in February,” economist Kelvin Davidson said.
The central Wellington region still has prices 1.1% lower than three months ago.
CoreLogic likes to hype things up, so if they’re saying Wellington is down 30%, it must be bad. They’re also saying the downturn is over because the Monthly Change in HVI (%) is 0.28%.
But we’re still down -3.82% Annual Change HVI (%) nationwide and -5.68% for Auckland. So we've only had a quarter over the summer months where prices were flat perhaps from OCR cuts before summer and a forecast of the one that just happened.
As we head into winter, inventory is piling up already at 2015 levels, and unemployment is forecast to rise from 5.1% to 5.5%. NZ could even become a net exporter for immigration. Also not a good look with Orr leaving.
The only thing I’ve heard in favour of house prices is lower oil prices and a lower OCR, but if oil has bottomed and we don’t see any more OCR cuts, is there anything left to support the NZ housing market? Watercare restrictions?
Aside from CoreLogic, what other groups put out similar data?
We welcome your comments below. If you are not already registered, please register to comment
Remember we welcome robust, respectful and insightful debate. We don't welcome abusive or defamatory comments and will de-register those repeatedly making such comments. Our current comment policy is here.