

Analysis by the World Gold Council.
So, what does this milestone really mean? Depending on who you ask: a lot or not much at all. For us, there are interesting psychological and technical aspects about this triple-zero ending price that could influence gold’s short-term behaviour. But the more meaningful – and lasting – dynamics are the ones behind gold’s performance over the past several months.
What’s meaningful about gold’s move?
Gold reached more than 40 new all-time highs in 2024 and fourteen more so far this year.2 Its upward move has been no coincidence and, in our most recent Gold Market Commentary, we talked about a potential perfect storm forming for gold. The focus isn’t just the number itself but the pace at which gold has reached it. The jump from US$2,500/oz to US$3,000/oz took just 210 days – a notably faster move that underscores the momentum gold has built over the past two years (Chart 1). Compare that to the approximate 1,700 days that gold took, on average, to achieve previous US$500/oz increments, and the move stands out (Table 1).
Chart 1: Gold’s recent surge defied historical trends, reaching $3,000 in record time
Historical price data shows gold has averaged 1,708 days to climb $500 increments, yet the latest jump took just 210 days*
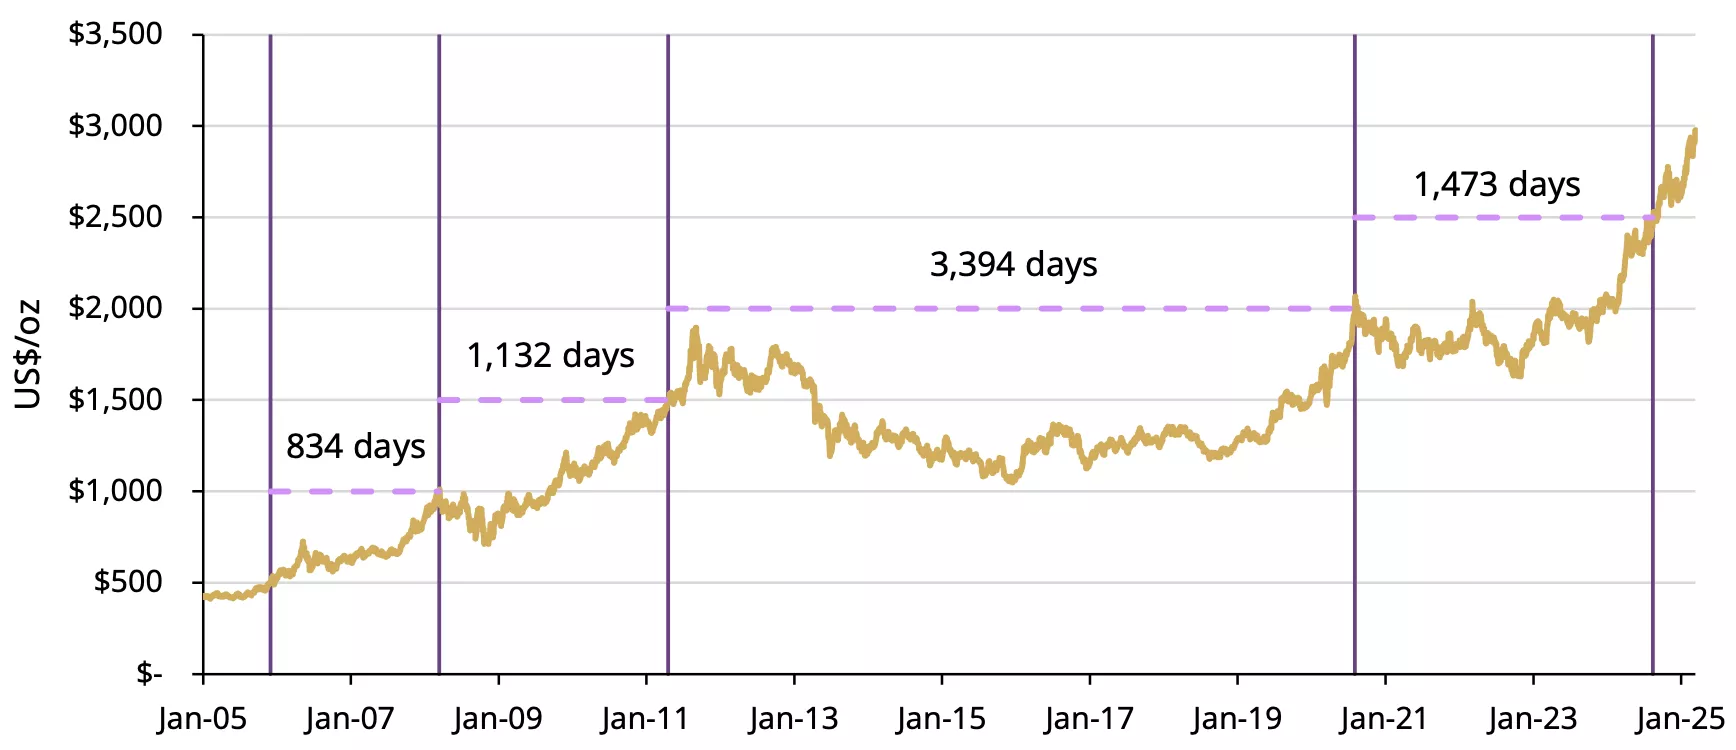
*Each vertical lines signifies the date when each initial $500 incremental level was breached starting with $500 (far left side) and the last line (furthest to the right) representing $2,500
Source: Bloomberg, World Gold Council
Table 1: Historical gold price support & resistance level overview
Historical gold price support and resistance level summary*
| Price Level ($/oz) | Breakout date | Days above | Initial pullback date | Recovery date | Round trip days | Days to next milestone | Years to next milestone |
| 500 | 12/01/05 | 18 | 12/20/05 | 12/22/05 | 2 | 834 | 2 |
| 1,000 | 3/14/08 | 3 | 3/18/08 | 09/11/09 | 542 | 1132 | 3 |
| 1,500 | 4/20/11 | 14 | 05/05/11 | 05/09/11 | 4 | 3394 | 9 |
| 2,000 | 08/04/20 | 6 | 08/11/20 | 8/18/20 | 7 | 1473 | 4 |
| 2,500 | 8/16/24 | 5 | 8/22/24 | 8/23/24 | 1 | TBD | TBD |
| Average | 9 | 111 | 1708 | 4.7 | |||
| Median | 6 | 4 | 1303 | 3.6 |
*Based on the LBMA Gold Price PM as of 17 March 2025. Breakout date defined as first day gold broke through resistance. Pullback date defined as first date that gold fell through support level (resistance level it just broke). Recovery date is the date on which gold round tripped back through its prior support/resistance level and stayed above that.
Source: Bloomberg, World Gold Council
In fairness, gold had to double in price to go from US$500/oz to US$1,000/oz, while it only had to rise 20% to go from US$2,500/oz to US$3,000/oz. To provide additional context, gold has increased nearly sixfold since December 2005, when it first reached US$500/oz, equivalent to an annualised return of 9.7%. Over the same period, the S&P 500 spot index has increased at a rate of 8.2% per year.3
To take this relative movement into account, we look instead at how much gold has deviated from its 200-day moving average (200DMA). The recent rally has pushed gold’s price three standard deviations (3σ) above the long-term average spread of its 200DMA (Chart 2). Most recently, we saw this extreme divergence during the COVID-19 pandemic in 2020 when gold crossed US$2,000/oz and again around the time gold reached US$2,500/oz. Following these moves there was a period of consolidation before the upward trend eventually resumed.
Chart 2: Gold’s recent move to US$3,000/oz represents a 3σ divergence above its moving average
Difference (spread) between spot gold (XAU) and its 200DMA*
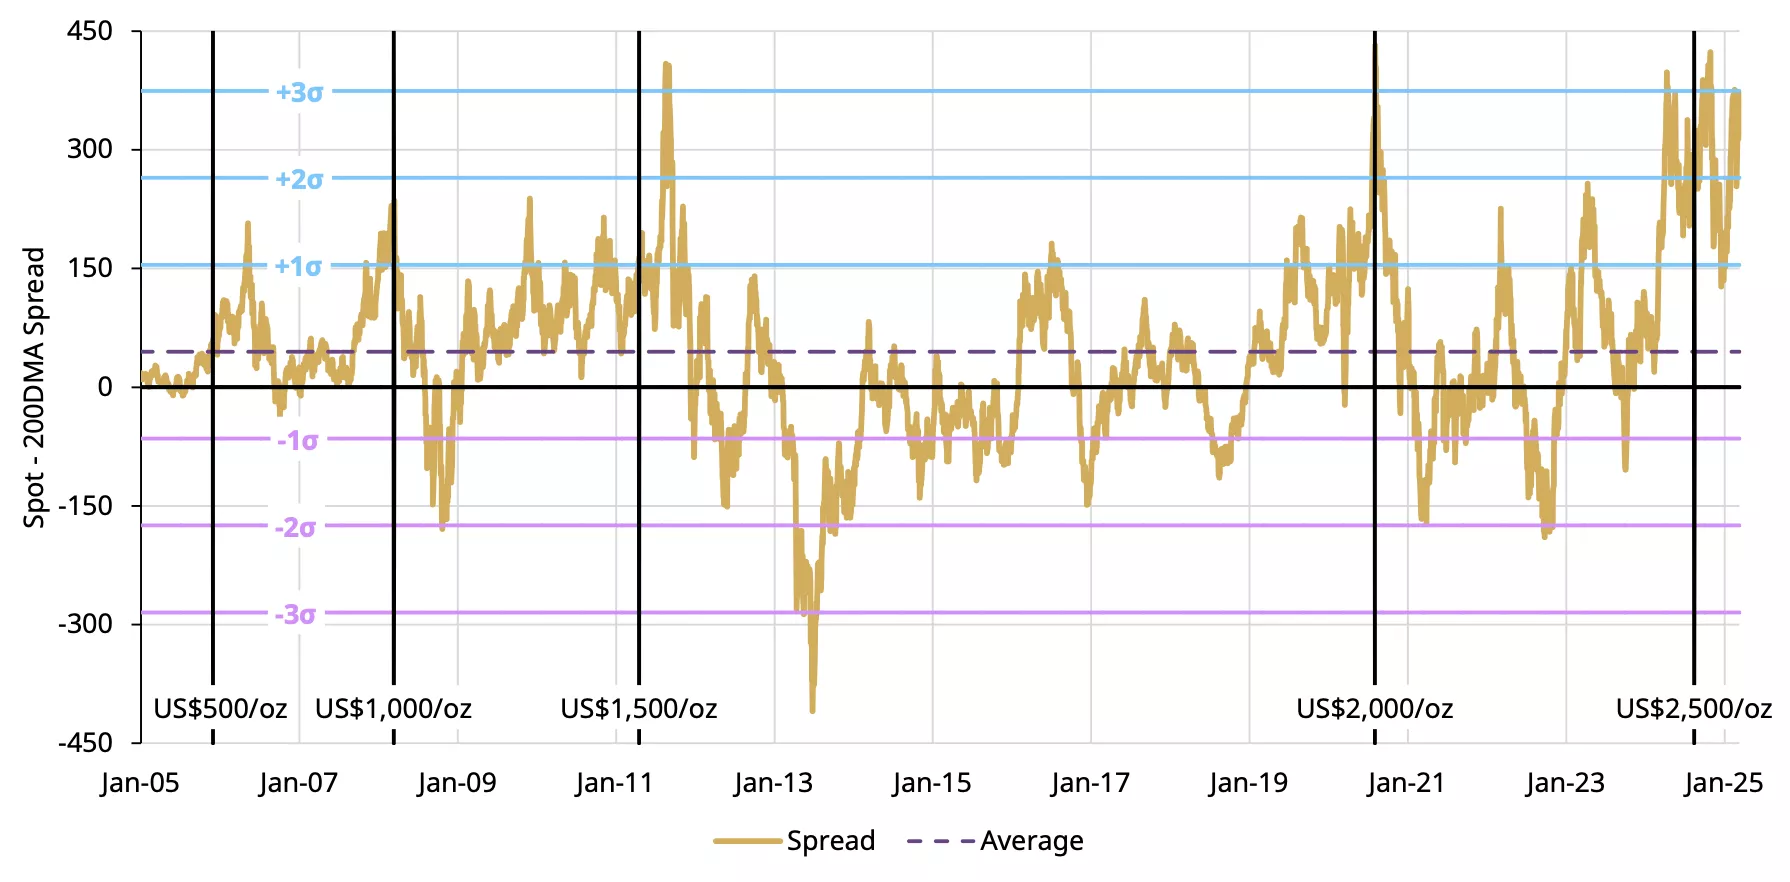
*Based on spot gold (XAU) as of 14 March 2025. Spread calculated as daily difference between spot price and its 200DMA. Each vertical black lines signifies the date when each initial US$500/oz incremental level was breached starting with US$500/oz (far left side) and the last black line (furthest to the right) representing US$2,500/oz.
Source: Bloomberg, World Gold Council
What’s next?
As the saying goes, “even strong rallies need to catch their breath.” Gold has remained, on average, above previous multiples of US$500/oz for nine days before pulling back (Table 1). At the same time, however, gold has rebounded above the same level in just a few days four out of five times.
From a technical and positioning standpoint, if gold were to remain above US$3,000/oz over the next couple of weeks, it would likely trigger additional buying from derivatives contracts. For example, we estimate there is roughly US$8bn in net delta-adjusted notional in options contracts from US gold ETFs that expire Friday 21 March,4 and US$16bn in options on futures that expire on 26 March. While this may create a slingshot effect, it could also trigger short-term-profit taking.
In view of the speed of gold’s latest move, it would not be surprising to see some price consolidation. But despite potential short-term volatility, the most important determinant for gold’s next move is whether fundamentals can provide long-term support to its trend. As we discussed in our recent Gold Demand Trends, while price strength will likely create headwinds for gold jewellery demand, push recycling up and motivate some profit taking, there are many reasons to believe that investment demand will continue to be supported by a combination of geopolitical and geoeconomic uncertainty, rising inflation, lower rates and a weaker US dollar.
Footnotes
1. Indicative Bloomberg data on spot gold (XAU) suggests that gold broke through US$3,000/oz in the morning of Friday 14 March and Monday 17 March 2025.
2. Based on the LBMA Gold Price PM, as of 17 March 2025.
3. Including and reinvesting dividends, the S&P 500 has increased by approximately 10% between 1 December 2005 and 14 March 2025.
4. The delta adjusted notional outstanding is based on options on the largest two US gold ETFs, GLD and IAU, which we estimate at $8bn and $20mm, respectively as of 17 March.
This article is a re-post from here.
![]() Our free weekly precious metals email brings you weekly news of interest to precious metals investors, plus a comprehensive list of gold and silver buy and sell prices.
Our free weekly precious metals email brings you weekly news of interest to precious metals investors, plus a comprehensive list of gold and silver buy and sell prices.
To subscribe to our weekly precious metals email, enter your email address here.
Comparative pricing
You can find our independent comparative pricing for bullion and coins in both US dollars and New Zealand dollars which are updated on a daily basis here »
Precious metals
Select chart tabs
1 Comments
https://www.visualcapitalist.com/how-much-gold-exists-for-every-person-…
There’s Not a Lot of Gold for 8 Billion People
Turns out, there really isn’t a lot of gold in the world.
To date, only 244,000 metric tons of gold have ever been discovered. This includes historical production and current known discoveries.
That works out to about 30 grams (about one troy ounce), or six gold rings, for every single human being on the planet.
We welcome your comments below. If you are not already registered, please register to comment
Remember we welcome robust, respectful and insightful debate. We don't welcome abusive or defamatory comments and will de-register those repeatedly making such comments. Our current comment policy is here.