
Here's my Top 10 links from around the Internet at 10:00 am today.
Bernard is back tomorrow with his version.
As always, we welcome your additions in the comments below or via email to bernard.hickey@interest.co.nz.
See all previous Top 10s here.

1. The RBA uses inflation as its friend
Tony Abbott has beaten Kevin Rudd in Australia. We may not be surprised, but those looking on from the US are. Left leaning observers see Australia as a proving-ground for economic theory. Really? (See Jason Krupp in the next item.)
The idea of not targeting inflation as the monetary policy focus, but nominal GDP is a bit of a theme running through today's Top 10.
Anyway, here's US-based observer Matthew Yglesias in his MoneyBox blog.
You see, even though nobody seems to care about Australia it's a fascinating economy. What's fascinating about it is that they don't have recessions anymore - it's been over 20 years since an economic contraction.
Since apart from the recession thing, Australia seems in many ways similar to the United States - a rich, low-density, high-population-growth, English-speaking federal state with a structural trade deficit - you'd think people would be eager to learn recession-fighting lessons from Australia. In particular, the lesson I think they should learn is that if you strategically allow inflation to overshoot as your response to shocks then you don't have to have recessions.
My theory, in other words, is that Australia doesn't have recessions thanks to the good work of the Reserve Bank of Australia. But the conventional wisdom is that we should thank mineral exports. The three big problems with the mineral-centric view, it seems to me, are this. One is that though the 2008 global recession came at a time of high commodity prices, the 2000 global recession did not. The second is that if rapid Chinese economic growth automatically led to economic growth in China's trade partners, you'd expect to see this impact in Japan as well as Australia. The third is that Australia is not a net exporter and in fact has never been a net exporter so it's hard for me to understand how you could credit their export sector as the key to full employment. It has to be a story of domestic demand.

2. We're on a roll
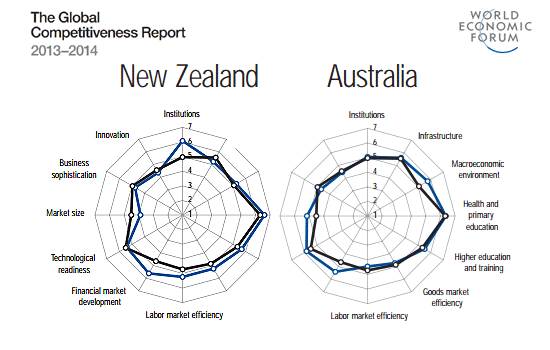
Benchmarking is a useful exercise. The latest is a comprehensive global competitiveness study, assessing in detail some 119 factors. New Zealand not only scored well, we improved sharply. The study covered 148 economies, and we are in the tough first-tier "innovation-driven" group of 37. A key part of this survey is the sustainability overlay. Jason Krupp at the NZ Initiative reviewed the results:
The report showed New Zealand is ranked as the 18th most competitive economy in the world, up five places on last year, but more importantly – at least from a patriotic point of view - three places ahead of Australia, which dropped out of the top 20 for the first time ever.
Coming hot on the heels of the Bledisloe Cup drubbing, it reinforced the view that it’s a fine time to be living in Aotearoa (which this researcher wholeheartedly agrees with).
The report shows Kiwis are getting the basics right with our institutions; health and education systems all ranked in the top 10 globally. Our policy settings are also delivering dividends with the economy highly ranked for financial market development as well as goods and labour market efficiency.
Meanwhile, Australia’s softer performance was largely attributed to the inflexibility of its labour market, which was ranked 137th in the world for the rigidity of its hiring and firing practices (out of a possible 148), as well as the regulatory burden placed on businesses (128th globally).
But before we congratulate ourselves too heartily for showing our brethren across the Tasman just how an economy should be managed, it’s also worth checking where our warts are.
We ranked fairly low down for macroeconomic environment and market size (43rd and 62nd respectively), although it’s hard to see how we could alter those factors.
New Zealand is also well behind Australia on infrastructure (27th versus 18th) and technological readiness (24th versus 12th).
Indeed, when you look at business sophistication and innovation factors, we’ve made zero headway in the past 12 months (ranking 27th in the world on a combined basis) despite the fact it’s widely accepted that this is where we need to be making up ground.
Right now economic growth is jogging along at a 2.5 percent pace, predominantly driven by dairy exports to Asia and the Canterbury rebuild. However, the latter will fade and you only have to look at Australia’s post-resources investment struggles to appreciate the dangers of overspecialising.
So, while New Zealand’s position in the WEF rankings is something to be proud of, if real value is to be extracted from the report it should be used as a rallying call to further improve our competitiveness.
3. 'Very big disruption is coming'
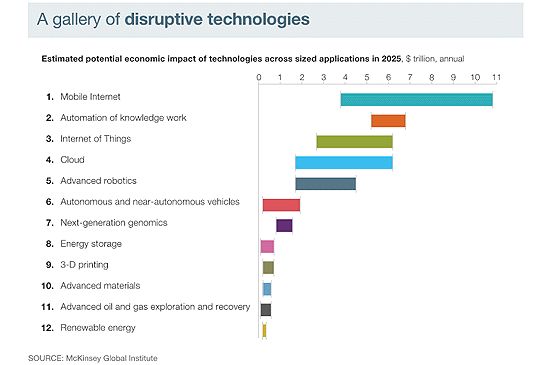
You need to be very brave (or foolish?) to attempt to predict the future. But with so many claims around 'disruptive technologies' someone needed to step up and show in what areas they will be and what the economic impacts we can expect. McKinsey & Co have made an attempt. It's a report well worth reading. (And maybe Verizon didn't pay too much for control of its mobile unit.)
The relentless parade of new technologies is unfolding on many fronts. Almost every advance is billed as a breakthrough, and the list of “next big things” grows ever longer. Not every emerging technology will alter the business or social landscape—but some truly do have the potential to disrupt the status quo, alter the way people live and work, and rearrange value pools. It is therefore critical that business and policy leaders understand which technologies will matter to them and prepare accordingly.
We estimate that, together, applications of the 12 technologies discussed in the report could have a potential economic impact between $14 trillion and $33 trillion a year in 2025. This estimate is neither predictive nor comprehensive. It is based on an in-depth analysis of key potential applications and the value they could create in a number of ways, including the consumer surplus that arises from better products, lower prices, a cleaner environment, and better health.
Some technologies detailed in the report have been gestating for years and thus will be familiar. Others are more surprising. Examples of the 12 disruptive technologies include advanced robotics, next generation genomics, and energy storage devices.
4. Today's raw market data ...
A quick new-week update:
| as at 11:10am |
Today 9:00 am |
Friday |
Four weeks ago |
One year ago |
| NZ$1 = US$ | 0.7795 | 0.7890 | 0.8044 | 0.8110 |
| NZ$1 = AU$ | 0.8724 | 0.8645 | 0.8747 | 0.7821 |
| TWI | 75.56 | 74.82 | 75.39 | 72.37 |
| Gold, US$/oz | 1,387 | 1,385 | 1,341 | 1,732 |
| Dow | 14,946 | 14,925 | 15,425 | 13,352 |
| Copper, US$/tonne | 7,171 | 7,103 | 7,246 | 8,032 |
| Volatility Index | 15.87 | 15.78 | 12.81 | 16.28 |

5. Why American agriculture is different
Ask any European; American agriculture is all about big business. It's a willful type of blindness that ignores an awful lot. Spend any time in rural America (I have) and you get to see that American farmers don't much like Big Ag either, but its not an obsession. What they do think a lot about is the science. Which makes them more like NZ than the old world.
It's cultural, and no small thing. The Economist has been looking at 4-H. Never heard of them? Well you are missing a rural youth organisation with 2 million members. Two million motivated rural 'scientists' can accomplish a lot.
Visiting the Nebraska State Fair recently, Lexington toured a pavilion of 4-H projects. Some entries might be found at fairs in many countries: jars of jam, prize-winning vegetables and woodwork (your columnist frankly coveted a Perspex-fronted squirrel-feeding maze). But there was a striking emphasis on science and business, too. Alongside long shelves of model rockets, entries included a display on pig-eye dissection and a statistical analysis of poultry diseases. Eleven-year-old Cale Urmacher, a fourth-generation 4-H member, gave a robotics demonstration. Becca Laub, 16, outlined her plans for a tomato- and fish-farming enterprise and her ambitions to study engineering. People think farmers are uneducated, she scoffed. Her father has an economics degree and uses it to track market trends. Also, thanks to global-positioning gadgetry, one of the family tractors can drive itself, which is “pretty cool”.
America is “completely set up” to supply soaring world demand—as long as it can keep using GM crops and other technology, says Will Miller, a UNL student who reared enough heifers as a 4-H member to pay his way through college. Not all young farmers are as biotech-keen. 4-H offers organic projects, too (deftly treading a path through the culture wars that dog so many fields in America, including science). But many are just as enterprising. America set out to plant science and capitalism in its farm kids. They have taken deep root.
6. Paying big for nothing
Germany's aggressive and reckless expansion of wind and solar power has come with a hefty pricetag for consumers, and the costs often fall disproportionately on the poor reports Germany's Spiegel Online.
Green energy has become a regressive tax, they say.
It is only gradually becoming apparent how the renewable energy subsidies redistribute money from the poor to the more affluent, like when someone living in small rental apartment subsidizes a homeowner's roof-mounted solar panels through his electricity bill. The SPD, which sees itself as the party of the working class, long ignored this regressive aspect of the system. The Greens, the party of higher earners, continue to do so.

7. Winners and losers
Job markets value experience, it seems. The latest HLFS employment data confirms the rise and rise of the employment rate for older Kiwis. In fact, the Q2 employment rate for those 55 to 65 has never been higher, a record since modern data has been available starting in 1986.
The following graphic shows what has happened since 2007. Over a longer period - the past 20 years - the trend is even stronger. What that says is that those who got jobs in the 1980s (after the freeing up of the Muldoon state) have gotten more valuable as employees as they have aged, and are now at their peak. They have captured the political process, the [housing] wealth, and the jobs. Those coming later (GenX, GenY) have not been as competitive.
Why is that? Education? Social skill? Motivation? Drive? How come one group has flourished more than those who followed? Perhaps you needed to have chaffed under Muldoon first to have really valued the release. Maybe the followers are taking the [economic] freedom for granted, as a right? The stats go against the popular misconception that over 40's are on the 'scrap heap'.

8. We need the dogs to bark
Nick Rowe explains why he's now a fan of targeting nominal GDP rather than inflation - if you were a central banker with your hands on the levers. (also see Keonig.)
We had three guard dogs, named IT, PLT, and NGDPLT, that were all saying about the same thing from 1992 to 2008. The Bank of Canada listened to the first of those three dogs, and things seemed to go pretty well. So we figured IT was a good guard dog.
In 2009 things changed. The Bank of Canada kept on listening to the IT dog, and did what was needed to make sure the IT dog stayed fairly quiet. The PLT dog stayed fairly quiet too. But the NGDP dog started barking loudly, telling us that monetary policy was too tight. And when I looked out the window, I saw exactly those symptoms that I normally associate with a random tightening of monetary policy: people having greater difficulty selling things for money; greater ease buying things for money; and a fall in the quantities of things sold for money. I saw exactly the same sort of recession I would expect to see if monetary policy suddenly at random became too tight.
The NGDP dog was right to start barking loudly; the IT and PLT dogs failed to warn us of the recessionary burglar.
9. Neglecting the central problem
It has been 5 years since Lehman Bros folded. But Martin Hesse at Spiegel says few lessons have been learned. He points out that the 'central problem' remains unresolved - that being the amount of at-risk capital banks are required to hold. Our banks are still only at about 8%.
Capital rules are a case in point. "Contrary to their political rhetoric, Germany, France and even Japan have blocked the acceptance of tougher requirements in international negotiations," says financial expert Harald Hau of the University of Geneva. Their goal, he adds, is to avoid putting their own, undercapitalized banks under pressure.
At the time of the Lehman bankruptcy, many large banks maintained an equity cushion of only 2 percent of their total assets. The remaining 98 percent was borrowed capital. As a result, even small losses could lead to bankruptcy. Today, this cushion amounts to about 3 percent at many banks. "It's still far too little," says Hau, who believes that an equity cushion of 15 to 20 percent is ideal.
Regulators' notions are still well removed from such quotas. Meanwhile, they are fine-tuning complicated regulations that would require banks to maintain larger capital reserves for riskier transactions, and smaller reserves for those that are supposedly safer. This sounds reasonable, but the amount of risk associated with a deal often only becomes apparent in retrospect.
For instance, there are still no capital reserve requirements for many government bonds today, even though hardly anything threatens the existence of banks as much as the sovereign debt crisis. But who else would finance the excessive borrowing of governments?
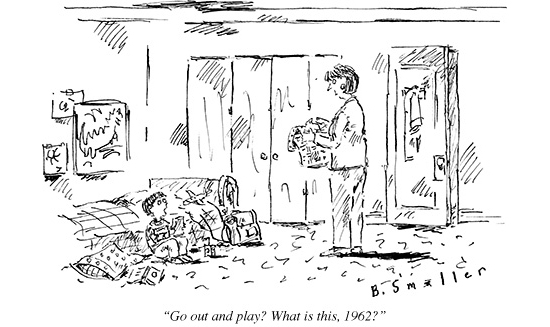
10. Today's quote
"People are living longer than ever before, a phenomenon undoubtedly made necessary by the 30-year mortgage." - Doug Larson
24 Comments
"If you start saving money now, you'll be able to borrow more later"
Haha so true.
with one charge for a box entering NZ direct to consumers or small business or up to 20 charges on imports. you can get the idea, four times the cost!!. Its a showrooming world now so we need a higher dollar right??
#2 compliance driven by government order
#3 those details are for the last 5 yrs. Not the future. Future is more money, less buying power. More social services and specialisation, less development and independence. More advertising revenues, less goods and services competition.
#7 The big problem was the Mould-oon and previous governments tried to control everything. Parallel and grey imporitng illegal. Exporters hamstrung by NZ tax law and regulators. Draconian interference in economy that distorted market and expectations (subsidises to provide "cheap goods and services" that actually cost a lot more to produce than could be justified. Market reactionary influence rather than work to produce better technology and distribution (carless days, price freezes)
Avian Bird Flu ? .... nope , had that .... 99.99999 % of us survived that .... even though the government ( Herr Helen ) wasted $NZ 200 million on unneeded flu shots ....
... ummmm , peak oil ? .... nuh ... they keep finding billions of barrels of the stuff ....
... $ 600 000 salaries for bone-idle useless bureaucrats ! ... now that one does scare me witless ... what on earth possesses them to pay that sort of munny when they could employ someone equally as hopeless from WINZ for just $ 16 per hour ...
Auntie Helen did not too waste all our dosh on bird flu shots...GBH...what if Chicken Licken and Henny Penny Hickey had caught it and become all delerious like....?
So no, not wasted, you need a clear mind to steer the comment here at int.co.
On ...3....there's qualified hopeless , then there's them that don't know it.
... ummm , so Bernard " Chicken Little " Hickey isn't normally delerious when he writes his stuff ?
Wow ! .... had me fooled all these years , then ...
I thought you might spot the gaff...!
... nah , it fell overboard as I was hauling the Hickeyfish in ....
Hey Count ..... who needs disruptive technologies ... we got cows ! None of that new-fangle-dangled fancy-pantsy smart-arse technology for us , no sirreeeeee JimBob , we got Daisy and Bessie ...
... that's all that the simple folk of Aoteo .... Aorteaor ... Arteor ... Kiwi-land need ...
The point is moo .............GBH.
too much overhead to create a sustainable technology economy.
systems leakage is more than a GCSB report.
It's Adam Smith thing, tech economy requires a population of specialists, yet the inflation effect of technical specialisation means a large population base of technology consumers (upgraders, sellers; not end users) is required to give sustained demand.
Without self-sustaining demand, the tech specialists get redundant too quickly and end up drifting back to the cows. but tech specialism demand is expensive.
So government tries to force it, but they keep drawing from the very processes they claim they supporting, and there's always a loss in collection....
So I was correct , it's more sustainable to base our economy on the cow , boy ?
... dang ! ... Hey Count ..... the Gummster got summit right again ..... that's twice this century .... cool !
The interesting thing is of course when you take what is such an extrem right wing viewpoint, then that colours or sets a context in anything else you say/write.
Tis simple, write politically blinkered garbage about thiongs you have no idea on, makes me at least wonder just how credible your so called survey(s) is. Clearly if you cant do maths in one area the maths in your area of dubious expertese has to also be questionable.
[ this portion deleted as personal abuse. Ed]
regards
Argh, the misuse of numbers, it burns.
In describing the Northern ice caps as being 60% greater than the equivalent last year, let's just keep in mind that last year was the lowest ever recorded, and quite frankly a 60% increase on that only means it is one of the lowest ever recorded not that it was high.
Let's put real numbers on this.
2012, about 3.2 (million sqr km) + 60% equals about 5.12
2008, third least in history, somewhere about 5 (I am reading this numbers off a graph so am not being exact)
Average 2000-2009, 5.5
Average 1990-1999, 6.8
This years figures are basically the same, in what was a gold summer over the north pole, as the 2007 figure, but you can't make trend judgements from one data point.
To show what a bad use of statistics this is: The amount of building consents in Auckland City went up 40% between September 2002 and September 2003, so clearly the housing affordability crisis finished back then.
Arrrrr I know! it is especially agonizing whenever Hugh posts anything to do with science as he has shown time and time again to know nothing about science. Anyway, for a rational balance here is a link to a graph of the sea ice measurements over the last few years. Observant people will note that the ice volume is still well below the mean of 1979-2012 measurements.
Satellite Ice Measurements:
@Plutocracy
An ad hominem attack has never been a sign of intelligence!
I would be careful about defending Hugh on this one, his work in planning relies heavily on statistics but he has just demonstrated a poor understanding of them and the application of logic. It is a pretty serious mistake and leaves him with a serious credibility problem. At a very minimum he has shot from the hip without checking the facts because it confirms his bias. Again a serious credibility issue arises.
The Daily Mail is not known for its considered analysis.
For something unrelated to understanding trends over time, here is an article about the first Chinese cargo ship to ever travel to Europe north around Russia, which it was able to do due to the lack of ice this year (remember 60% more of not much is still not very much). The Russians have been seeing a boom this year and last year in travel via this coast. The Chinese trip has been making news this month and last.
Link via Financial Times
Actually, just to show a certain inconstancy in the Daily Mail's thinking, here is their story on the Chinese Freighter from the start of its voyage last month.
Actually, not many bureaucrats will absolutely - despite prodding - continue to adhere to 50% of their 'data' as an unassailable 'given'.
You can actually learn, and a good deal about a good deal. Most folk capable of reading, can. Where most folk fall over, is in holding to preconceptions which don't fit the learned facts. At a certain point of unwelcomeness, the fact is rejected. Presumably, all folk heading into Oncology wish they weren't going there, and weren't about to hear bad news. Doesn't alter the fact that they are and they are.
So we get denial, obfuscation, spin. All intended to stave off the unpalatable, and some of it goes as far as being 'belief'.
And logic says that in all things with potential major down-sides, you should err on the side of caution. The precautionary approach. In the case of fossil-fuel carbon, you either sequester all of it, or you cease using it until guaranteed that it's OK. The avoidance of the precautionary approach, has one driving reason; selfishness now.
The comment is Hugh knows nothing about science, which he proves time and time again.
Its quite interesting that many of the denialists reject climate science, yet when I point out peak oil issues, they claim science and technology will save them/us.
Cherry picking to suit thier right wing / libertarian stance...
regards
I just saw the best graphical representation I have ever seen of artic sea ice area
http://iwantsomeproof.com/extimg/siv_september_average_polar_graph.png
Also, now that scientists are actually getting to respond to the Daily Mail's clickbait, we are getting reply articles like the following (from someone who last year predicted this year would see a record number of "the ice is recovering stories" on the grounds that last year's ice was a exteme alltime low so this year's was likely to be higher so would produce such articles).
http://www.theguardian.com/environment/climate-consensus-97-per-cent/20…
Last year, 80% of scientists thought there would be more arctic sea ice this year than last, so them being right is not really news, unless like the Daily Mail you ignore what scientists are actually saying.
There seems to be a fair bit of congratulating ourselves on what a good government we have had compared to Australia's in the last 5 years since the GFC, and as per David's theme of the day, reasonable questions to pose of both countries sticking in theory with rigid inflation targetting as an official monetary policy. (Even though the paper in #1 suggests Australia has not followed such a target as religiously at all).
Following from Tradingeconomics.com are a few scores that compare NZ with Australia over the period 2008 to 2012-13.
Inflation. Australia started the period at 4.3%, got down to a brief low of 1.2%, before coming back up to a current 2.4%. Their average over the 5 years has been 2.8%. NZ started at 3.4%, came down to 1.7%, up to 5.3% (GST increase?) and down again to under 1% for the last year. Our average has been 2.54%, albeit masking considerable ups and downs, with the recent down being prolonged and very (dangerously?) low.
Their money supply- M3- has increased by a very large 60% in the period; ours has gone up 27%. As I don't think they have formally printed, this increase is presumably by the commercial banks, but endorsed by the RBA.
Current Account deficit: Australia has gone from a 6.2% deficit down to -2.2; and now back up to -4.6% with an average of -4.1%. NZ started at -8%, came down to -2.9%, and is now back up to -5.4%; with an average of -5.4%.
GDP/Capita at PPP in USD; Australia has increased by 3.6% from $34,425 to $35,668 in the five years. NZ has increased by 1.4% $25,300 to $25,700 in the same period.
Unemployment: Oz started at 4.2%, and came up to the mid to high 5s; and is now at 5.6% (despite absorbing a fair few Kiwis). Average 5.6%. NZ started at 3.9%, peaked at 7.3% and is now at 6.4%. Average 6.4%.
Fiscal position. Australia started with a surplus of 1.7%, came down to -4.3% and is currently at -3%. NZ started at +4.9% and in the last figure reported on the linked site was -8.4%.
In summary neither country has done all that well (but better than many in Europe- a very low barrier to get over); with the rigid inflation targetting arguably responsible for the current account positions in particular, where both countries have massively wasted very beneficial terms of trade. By most scores Australia has done better than NZ. Much I accept is mining cycles versus dairy cycles. Make of the data what you will.
Personally I would have multiple targets for the RBNZ and Treasury combined; including unemployment, nominal GDP, inflation, and the current account; with the current account my favourite.
Hugheys Homework:
Go read Garrett Hardin, 'The Tragedy of the Commons' (1968).
I touched on it in a recent lecture.
Then read "shopping our way to safety" (Szasz) or at least gen-up on inverted quarantine.
Both explain the selfish efforts which result in the election of ignorant govt's, vs the moves needed for the greater good. The Aussies have individually voted for their hip-pockets, at the collective expense of their children. To do so, they have to choose to believe something other than fact. It's interesting to investigate why.

We welcome your comments below. If you are not already registered, please register to comment
Remember we welcome robust, respectful and insightful debate. We don't welcome abusive or defamatory comments and will de-register those repeatedly making such comments. Our current comment policy is here.