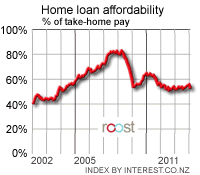
New Zealand home loan affordability worsened slightly in June from May as the median house price nudged up faster than incomes, the Roost Home Loan Affordability report shows.
However, affordability is set to improve through July as average two year mortgage rates have dropped slightly and house prices are expected to be flat to falling.
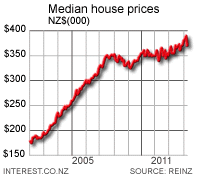
The national median house price rose 0.7% to NZ$352,500 in June from May, but remains down 2.2% from a record high of NZ$360,500 in March. This drove a slight deterioration in home loan affordability given the average 2 year mortgage rate was flat at 7.19%.
The Roost Home Loan Affordability report measures the affordability nationally and regionally for income earners and households, taking into account house prices, interest rates and incomes. Affordability improved significantly in Auckland, Northland and Queenstown as house prices dropped, but worsened in Christchurch where prices rose.
Affordability was best in Southland, Otago and Manawatu/Wanganui, while the Central Otago Lakes region continues to be the least affordable. Affordability is better than its worst levels hit in early 2007 near the peak of the housing boom and interest rates, but has broadly deteriorated in the last 12 months as house prices rebounded in the wake of interest rate cuts in late 2008 and early 2009, the monthly measure calculated by interest.co.nz in association with Roost found.
However, the national deterioration is not expected to extend into July as fixed mortgage rates have dropped and house prices are subdued.
“Fixed mortgage rates fell early in July after a fall in wholesale rates, which will improve the affordability equation for home buyers who choose to fix rather than float,” said Roost spokeswoman Margaret Smith.
“But the key for affordability in coming months will be house prices and whether the Reserve Bank continues to increase the Official Cash Rate,” Smith said.
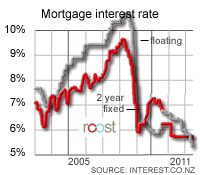
 The Reserve Bank lifted the Official Cash Rate to 2.75% from 2.5% on June 10 and economists expect it to increase it again to 3% on July 29. Banks passed on the hike in the form of higher floating mortgage rates in late June, but in early July they cut longer term fixed mortgage rates by 0.25% to 0.75% in line with lower wholesale rates as markets worried about a double-dip recession in the global economy.
Most home owners are still on fixed mortgages, but an increasing number are choosing to float given floating rates at just under 6% are still cheaper than longer term fixed rates at around 7%.
The Roost Home Loan Affordability measure for all of New Zealand showed the proportion of a single median after tax income needed to service an 80% mortgage on a median house rose to 61.8% from 61.4% in May and remains above its 56.1% level from June 2009.
The average 2 year fixed mortgage rate, which has been among the most popular with borrowers in recent years, was flat at 7.19% in June. But since the end of June the average two year fixed rate has dropped to 6.98%, suggesting an improvement in affordability to come if house prices are flat or falling. Average variable mortgage rates rose to 6.02% in June from 5.86% in May.
Variable rates are expected to rise to well over 6% by the end of 2010 as the Reserve Bank increases the Official Cash Rate. Affordability hit its worst level of 83.4% in March 2008 just after house prices peaked and 2 year mortgage rates were close to 10%.
 Many home buyers jumped in March, April and May of 2009 to take advantage of lower interest rates and look for bargains, which improved the number of houses sold and boosted prices. But short term mortgage interest rates flattened out in late March 2009 and longer term mortgage rates have bounced from their early 2009 lows. House sales volumes flattened off in the last three months of 2009 and early 2010 as first home buyers and rental investors stayed away. The OCR hike in June and the May 20 budget moves to remove depreciation as a taxable expense for property investors has seen house sales drop a further 20% during May and June.
Affordability is now very difficult in Auckland, Wellington, Christchurch, Hamilton and Tauranga for those on a single median income, but homebuyers in smaller provincial cities will find home ownership much more affordable. Affordability for the typical first-home-buyer also worsened slightly in June from May.
The proportion of a single after tax pay needed to buy a first quartile house rose to 53.8% from 52.9% in May and is up from 48.9% in June a year ago. This measure is for a median income earner aged 25-29 buying a first quartile home. Interest.co.nz thinks the ‘affordable' threshold is 40% for such a home buyer. Meanwhile, affordability for households with more than one income worsened slightly to levels last seen at the end of 2008.
This measure of a ‘standard typical household' found the proportion of after tax income needed to service the mortgage on a median house rose to 41.4% in June from 41.1% in May and 37.3% in June a year ago. This measure assumes one median male income, half a median female income aged 30-35 and a 5 year old child that receives Working-for-Families benefits.
 This remains near the worst level of standard household affordability since November last year and significantly above the 35% trough seen in January, February and March of 2009, when buyer demand returned to the housing market. Any level over 40% is considered unaffordable for a household, whereas any level closer to 30% has coincided with increased buyer demand.
The survey’s measure of a ‘standard first-home-buyer household' found the proportion of after tax income needed to service the mortgage on a first quartile home rose to 26% in June from 25.5% in May and is up from 23.5% in June a year ago. It has worsened from its best levels of 22% in February and March last year when some first-home-buyers returned to the market.
This measure peaked at 35% in June 2007. This measure assumes a first home buyer household includes a median male income and a median female income aged 25-29 with no children. Any level over 30% is considered unaffordable in the longer term for such a household, while any level closer to 20% is seen as attractive.
Southland remains the most affordable region for home buyers with a standard affordability measure of 32.6%, while the Central Otago Lakes (Wanaka and Queenstown) region is the least affordable on 78.4%.
No chart with that title exists.
3 Comments
Bulitt
But what if interest rates rise or fall in some structural way, thus changing the long run average.
You could argue that the consistently low interest rate policy run by Greespan and Bernanke, coupled with mass securitisation and the growth of the wholesale 'hot' money markets, reduced interest rates for almost a decade, making housing appear more attractive.
Now that cheap 'hot' funding has gone and interest rates, at least relative to the Official Cash Rate, are likely to be higher.
Tough to measure, but worth thinking about.
cheers
Bernard
Sam
No worries there Sam.
With support from the good people at Roost and others we'll be able to stay free.
cheers
Bernard
Here we go. My apols. Swamped. Back on stream tomorrow.
http://www.interest.co.nz/news/top-10-10-nz-mint-fresh-air-albany-fed-f…
cheers
Bernard

We welcome your comments below. If you are not already registered, please register to comment
Remember we welcome robust, respectful and insightful debate. We don't welcome abusive or defamatory comments and will de-register those repeatedly making such comments. Our current comment policy is here.