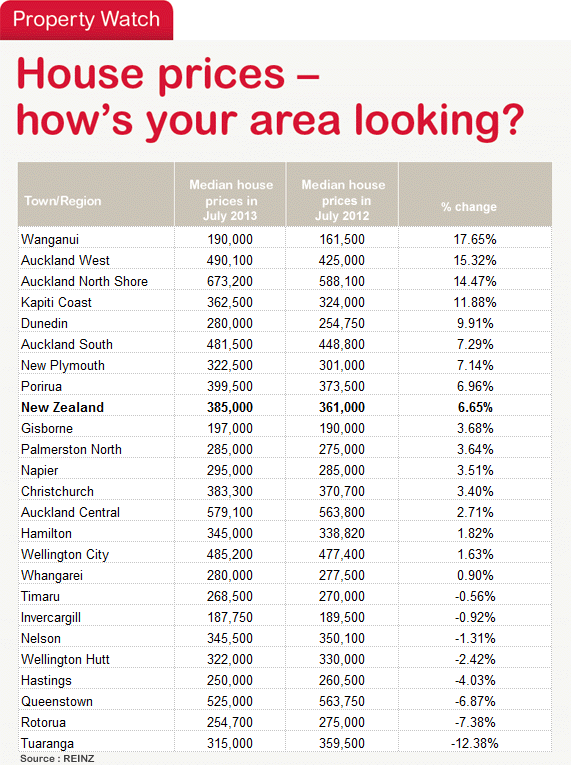
Home loan affordability improved slightly in July after the median house edge price edged lower as banks began tightening their lending to comply with the Reserve Bank's new 'speed limit' confirmed last week.
Mortgage brokers have reported banks increased their effective mortgage rates for low deposit borrowers over June, July and August, slowing lending growth and coinciding with a cooling of house prices.
The Reserve Bank announced a 'speed limit' on high loan to value ratio (LVR) mortgages last week, regulating high LVR mortgages to just 10% of new mortgage flow, down from the 30% seen before June.
The limit applies from October 1, but banks have six months to slow their high LVR lending and let their six month pre-approvals run down and have already acted to slow lending.
Banks have already begun offering preferentially low interest rates to borrowers with more than 20% equity and are imposing 'low equity premiums' on borrowers with less than 20% equity.
They are also tightening their lending criteria for those with poorer credit quality.
The Roost Home Loan Affordability reports show national affordability improved to 55.3% in July from 56.7% in June after the national median house price fell to NZ$385,000 from NZ$394,000 the previous month.
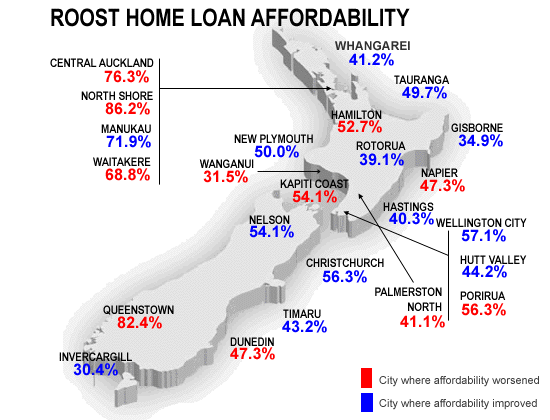
The reports show improvements in 13 regions and deteriorations in 11, largely due to movements in house prices in those areas. The reports measure the percentage of after tax pay needed to service an 80% mortgage on a median priced house.
"Banks are varying their offers much more than they have in recent years, which makes getting expert advice and help from a broker in those negotiations even more important," said Roost Mortgage Brokers spokeswoman Colleen Dennehy.
"Borrowers with more equity are also now in a much stronger position to work with a broker to negotiate better deals," Dennehy said.

The Roost Home Loan Affordability report for July showed affordability for regular home buyers improved in Manukau, Tauranga, Wellington, Hutt Valley, Christchurch and Invercargill where house prices fell, but deteriorated in Central Auckland, North Shore, Hamilton, Kapiti Coast and Queenstown where prices rose.
It is toughest for first home buyers in
Affordability on the North Shore is at its worst level in more than 3 years, although it remains below its worst ever levels of 107.3% of income required in November 2007 when interest rates were over 10%. They are now closer to 5%.
Nationally, affordability for someone on a single median income improved by 1.4% in July from June, which meant it took 55.3% of after tax income to afford an 80% mortgage on a median house, according to the Roost home loan affordability report released today.
Average fixed mortgage rates, which more than 50% of new borrowers now use, rose slightly in July and after-tax wages rose less than NZ$1 per week.
Housing affordability has become a major economic and political issue over the last year. The Reserve Bank and Government agreed on a toolkit of 'macro-prudential' controls in May that would see the central bank impose limits growth in high loan to value ratio mortgages. Central and local governments are also moving to address housing supply shortages.
For first home buyers – which in this Roost index are defined as a 25-29 year old who buys a first quartile home – there was also an improvement in affordability in most cities.
It now takes 47.3% of a single first home buyer's income to afford a first quartile priced house nationally, down from from 48.4% a month earlier. The most affordable city in
Any level over 40% is considered unaffordable, whereas any level closer to 30% has coincided with increased buyer demand in the past.
For working households, the situation is similar, although bringing two incomes to the job of paying for a mortgage makes life considerably easier. A household with two incomes would typically have had to use 36.4% of their after tax pay in July to service the mortgage on a median priced house. This is down from 37.3% in June.
On this basis, most smaller
For households in the 25-29 age group (which is assumed to have no children), affordability nationally improved to 22.9% of after tax income in households with two incomes required to service the debt, down from 23.5% the previous month.
Any level over 30% is considered unaffordable in the longer term for such a household, while any level closer to 20% is seen as attractive and coinciding with strong demand.
First home buyer household affordability is measured by calculating the proportion of after tax pay needed by two young median income earners to service an 80% home loan on a first quartile priced house.
---------------------------------------------------------------------------------------------------------------------------------------
Mortgage choices involve making a significant financial decision so it often pays to get professional advice. A Roost mortgage broker can be contacted by following this link »
---------------------------------------------------------------------------------------------------------------------------------------
No chart with that title exists.
Full regional reports are available below:


We welcome your comments below. If you are not already registered, please register to comment
Remember we welcome robust, respectful and insightful debate. We don't welcome abusive or defamatory comments and will de-register those repeatedly making such comments. Our current comment policy is here.