Multifactor model detailing attribution of gold’s drivers on its monthly returns*
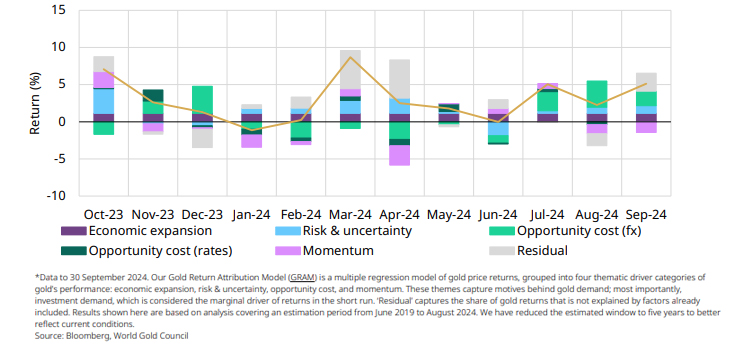
Table 1: Gold continued to post exceptional gains in September across all major currencies
Following strong monthly increases in July and August, gold posted another healthy gain in September to finish 4.6% higher at US$2,630/oz. It etched new highs eight times, with the latest one falling on 26 September before a very marginal decline into month end (Table 1).
According to our Gold Return Attribution Model (GRAM), gold was pulled higher by a further drop in the US dollar as the Fed embarked on its rate-cutting programme with a somewhat surprising 50bps cut (Chart 1). And similar to last month, the main identifiable negative contribution came from a momentum factor: the gold return in the previous month, which, when high, has a tendency to pressure the following month’s return lower. And vice versa.
Also of note in September, rising geopolitical tensions in the Middle East that have continued into October, helped the gold rally. And global physically-backed gold ETFs extended their inflow streak to five months. North American funds contributed the lion’s share of flows.
Chart 1: Continued weakness in the US dollar and an uptick in geopolitical risk helped proper gold higher in September
Multifactor model detailing attribution of gold’s drivers on its monthly returns*
Table 1: Gold continued to post exceptional gains in September across all major currencies
Performance of gold in various currencies*
| USD (oz) | EUR (oz) | JPY (g) | GBP (oz) | CAD (oz) | INR (10g) | RMB (g) | AUD (oz) | |
| September price | 2,630 | 2,359 | 12,101 | 1,962 | 3,552 | 70,858 | 593 | 3,790 |
| September return | 4.6% | 3.7% | 2.5% | 2.5% | 4.8% | 4.6% | 3.6% | 2.0% |
| Y-t-d return | 26.5% | 25.3% | 28.4% | 20.2% | 29.1% | 27.4% | 25.1% | 24.2% |
*Data to 30 September 2024. Based on the LBMA Gold Price PM in USD, expressed in local currencies.
Source: Bloomberg, ICE Benchmark Administration, World Gold Council
Looking ahead
Two years after both equities and bonds lost value – the first time this had happened for 53 years – the two continue to be highly correlated (Chart 2), although at least they are now going in the right direction…so far in 2024, both are up. While investors stand to gain, this high correlation undermines diversification benefits and raises total portfolio risk.
Chart 2: Bonds have a higher correlation to equities and therefore contribute more to overall portfolio risk
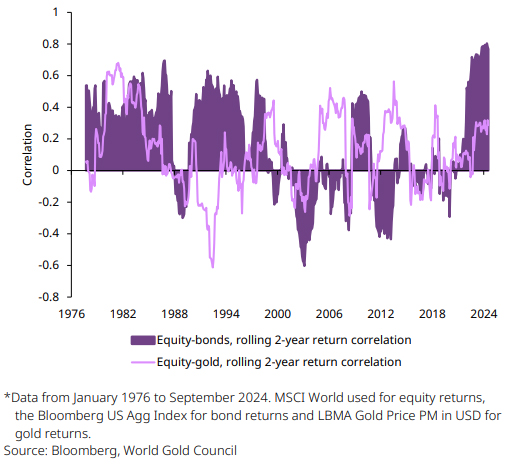
A recent report, based on a simple macro framework combining yields and corporate spreads, suggests that correlation is set to stay on this track.1 If this pans out, it will present many investors with a fundamental challenge around how to approach diversification; risk managers will continue to be nervous and interest in a diversifier and hedge like gold will likely remain high.
The framework divides the macro environment into four phases (Chart 3): QE-style goldilocks, fear of the fed, recovery, and risk-off, with each phase defined by the direction of bond yields and corporate spreads.
Chart 3: The four global macro regimes

*As of 30 September 2024
Source: MFS, World Gold Council
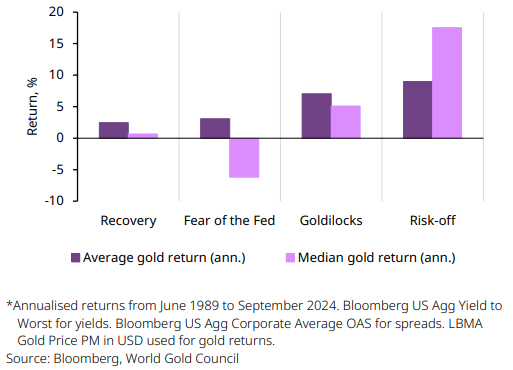
The median historical returns for each phase can be seen in Chart 4. Unsurprisingly, risk-off is the best environment for gold, followed by QE-style goldilocks. The latter is also characterised by a higher equity-bond correlation.
Chart 4: Gold performs best in a risk-off environment
Gold’s returns in the four global macro regimes*
Having experienced an acute volatility episode in early August, we found ourselves in a risk-off environment by the end of August (blue sector in Chart 5) – one that sees spreads widen as yields fall.
Zooming in on the likely sequencing of macro environments, a risk-off environment has historically been followed by a QE-style goldilocks environment 70% of the time. The least likely successor, based on this framework, is recovery, which coincidentally sees the lowest average returns for gold, as per Chart 4.
As we find ourselves in the balance between a soft and hard landing, current market dynamics suggest a QE-style goldilocks scenario is the most logical next step, with corporate spreads wavering.
Chart 5: Falling yields and stable spreads suggests we may be entering a goldilocks phase
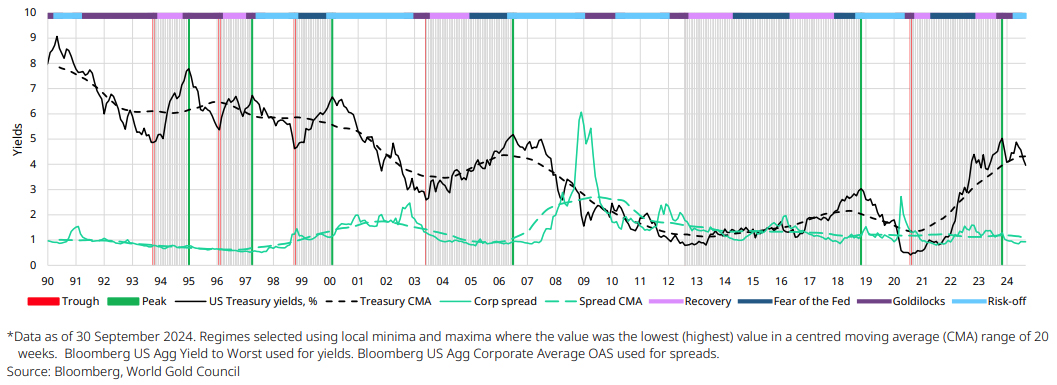
The Fed kickstarted its easing cycle with a 50bps rate cut in September, and the next chapter in the global macro narrative should involve broad and substantial rate cuts, which should be supportive of risky assets.
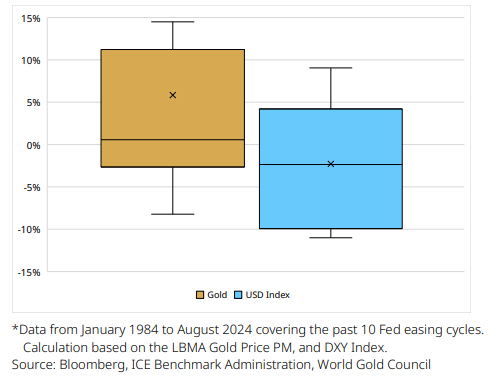
It is worth noting that gold stands to benefit. It has historically returned an average of 6% in the six months following the start of rate cutting cycles (Chart 6).
Chart 6: Aggressive cutting cycles have served gold well
Gold and USD returns in the first six months of a rate cut cycle over the past 40 years*
In summary
Against a backdrop of high equity-bond correlation and shifting macro phases, the outlook for gold offers investors diversification and a hedge against broader portfolio risk.
Add to this support from central bank buying, rising demand from key markets like India, and the return of Western ETF investors, and the recent escalation in Middle-East tensions, gold is well positioned to benefit from these evolving market conditions.
This article is a re-post from here.
![]() Our free weekly precious metals email brings you weekly news of interest to precious metals investors, plus a comprehensive list of gold and silver buy and sell prices.
Our free weekly precious metals email brings you weekly news of interest to precious metals investors, plus a comprehensive list of gold and silver buy and sell prices.
To subscribe to our weekly precious metals email, enter your email address here. It's free.
Comparative pricing
You can find our independent comparative pricing for bullion, coins, and used 'scrap' in both US dollars and New Zealand dollars which are updated on a daily basis here »
We welcome your comments below. If you are not already registered, please register to comment
Remember we welcome robust, respectful and insightful debate. We don't welcome abusive or defamatory comments and will de-register those repeatedly making such comments. Our current comment policy is here.