Gold demand excluding OTC in Q2 was down 6% y/y to 929t as a sharp decline in jewellery consumption outweighed mild gains in all other sectors. Adding in OTC investment to total gold demand yields a 4% y/y increase to 1,258t – the highest Q2 in our data series back to 2000.
The record gold price environment took its toll on Q2 jewellery consumption: volumes fell 19% y/y to a four-year low of 391t.
Central bank net gold buying was 6% higher y/y at 184t, driven by the need for portfolio protection and diversification.
A minor 7t decline in global gold ETF holdings in Q2 compared positively with the 21t drop in Q2’23. Sizable early outflows were followed by nascent later inflows.
Retail bar and coin investment was 5% lower at 261t, primarily due to weak demand from Western markets.
Gold used in technology jumped 11% y/y, as the AI trend continued to drive demand in the sector.
Highlights
- The LBMA (PM) gold price averaged a record US$2,338/oz in Q2 – 18% higher y/y and 13% higher q/q. Gold reached a new record of US$2,427/oz in May.
- OTC investment of 329t was a significant component of Q2 total gold demand. Together with continued central bank buying, it helped drive the price to a series of record highs during the quarter.
- Total gold supply grew by 4% y/y to 1,258t. Mine production of 929t was a record for a second quarter. Recycling supply was the highest for a second quarter since 2012, responding to the rising gold price.
- Regional investment trends continued to diverge. Demand for bars, coins and ETFs, was robust in the East, compared with a marked decline in the West. Western ETF investment flows have, however, started to return so far in Q3.
- 2024 full year outlook: revived Western investment flows to balance out weaker consumer demand and potentially slower central bank buying vs 2023.
Chart 1: Total gold demand reached its highest Q2 on record
Q2 total gold demand by sector, tonnes*
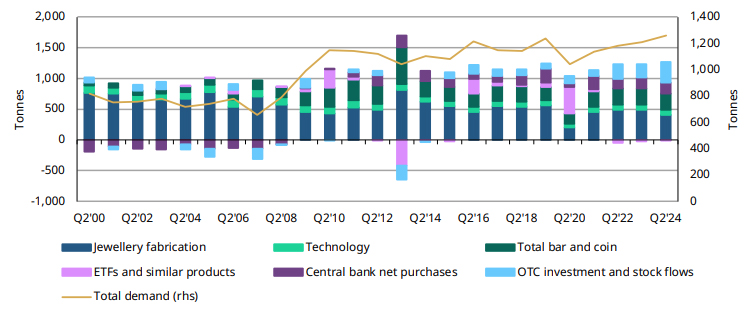
Sources: ICE Benchmark Administration, Metals Focus, Refinitiv GFMS, World Gold Council; Disclaimer
*Data as of 30 June 2024.
Gold supply and demand
| |
Q2'23 |
Q3'23 |
Q4'23 |
Q1'24 |
Q2'24 |
y/y %
change |
| Supply |
| Mine production |
899.7 |
937.3 |
954.6 |
859.1 |
929.1 |
 |
3 |
| Net producer hedging |
-15.7 |
23.8 |
23.0 |
-24.5 |
-6.3 |
- |
- |
| Recycled gold |
324.0 |
290.1 |
313.5 |
348.5 |
335.4 |
|
4 |
| Total Supply |
1,207.9 |
1,251.2 |
1,291.1 |
1,183.1 |
1,258.2 |
|
4 |
| |
| Demand |
| Jewellery fabrication |
494.1 |
581.0 |
583.4 |
534.4 |
410.6 |
 |
-17 |
| Jewellery consumption |
479.4 |
520.0 |
623.4 |
479.1 |
390.6 |
|
-19 |
| Jewellery inventory |
14.7 |
61.0 |
-40.0 |
55.2 |
20.0 |
|
36 |
| Technology |
72.8 |
77.3 |
82.2 |
80.5 |
81.1 |
|
11 |
| Electronics |
59.1 |
63.4 |
67.6 |
66.4 |
67.6 |
|
14 |
| Other Industrial |
11.3 |
11.6 |
12.2 |
11.8 |
11.3 |
|
0 |
| Dentistry |
2.4 |
2.3 |
2.3 |
2.3 |
2.3 |
|
-5 |
| Investment |
252.6 |
155.9 |
257.4 |
200.4 |
253.9 |
|
1 |
| Total bar and coin |
273.7 |
295.0 |
312.8 |
313.4 |
261.0 |
|
-5 |
| Bars |
164.0 |
206.8 |
220.7 |
223.3 |
183.6 |
|
12 |
| Official coins |
85.3 |
54.3 |
60.3 |
66.0 |
52.7 |
|
-38 |
| Medals/Imitation coins |
24.4 |
34.0 |
31.9 |
24.1 |
24.8 |
|
2 |
| ETFs & similar products |
-21.1 |
-139.1 |
-55.4 |
-113.0 |
-7.2 |
- |
- |
| Central banks & other inst. |
173.6 |
359.4 |
211.1 |
299.9 |
183.4 |
|
6 |
| Gold demand |
993.1 |
1,173.7 |
1,134.1 |
1,115.2 |
929.0 |
|
-6 |
| OTC and other |
214.9 |
77.5 |
156.9 |
67.9 |
329.2 |
|
53 |
| Total Demand |
1,207.9 |
1,251.2 |
1,291.1 |
1,183.1 |
1,258.2 |
|
4 |
| LBMA Gold Price (US$/oz) |
1,975.9 |
1,928.5 |
1,971.5 |
2,069.8 |
2,338.2 |
|
18 |
Source: ICE Benchmark Administration, Metals Focus, World Gold Council
This article is a re-post from here.
 Our free weekly precious metals email brings you weekly news of interest to precious metals investors, plus a comprehensive list of gold and silver buy and sell prices.
To subscribe to our weekly precious metals email, enter your email address here. It's free.
Comparative pricing
You can find our independent comparative pricing for bullion, coins, and used 'scrap' in both US dollars and New Zealand dollars which are updated on a daily basis here »
We welcome your comments below. If you are not already registered, please register to comment
Remember we welcome robust, respectful and insightful debate. We don't welcome abusive or defamatory comments and will de-register those repeatedly making such comments. Our current comment policy is here.