The domestic demand for both pruned and structural logs remains strong and supply ranges from balanced to tight around the country, apart from a temporary glut of pruned logs in the Central North Island.
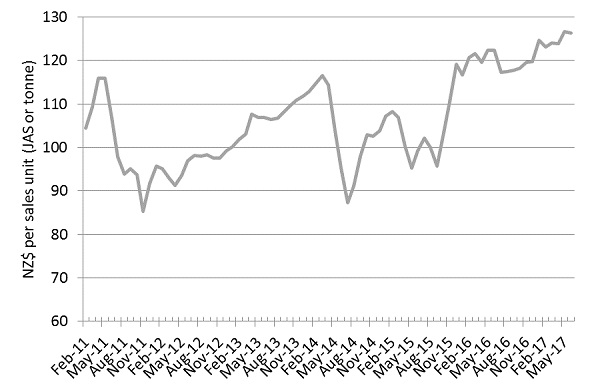
The PF Olsen Log Price Index for June has dropped one dollar from the record May figure and is now at $126. The average sale price is $15 per tonne above the three year average.
Domestic Log Market
Pruned
There continues to be strong demand for good quality pruned logs. There is currently a small oversupply of pruned logs in the Central North Island region. Feedback from the pruned mills is that they were struggling for supply over the last couple of months and this shortage was exacerbated by the weather events. Some clear-wood mills even stopped production for a day here and there due to low supply. The pruned logs that had been stockpiled in the forest due to a lack of access, have now flooded into the mills (pun intended) with the recent improved weather. A couple of the larger forest owners also had to rearrange harvest schedules because of the weather, and this caused a few harvest crews to unexpectedly move into pruned stands. This is expected to only be a temporary situation, and we should see a return to the slightly tight supply situation for clear-wood logs. Domestic pricing has been steady around the country for both pruned and structural logs. Most pricing for domestic log supply is negotiated on a quarterly basis, so we should have more to report in the July Wood Matters with the start of Quarter Three on July the 1st.
The clear-wood mills have had very steady demand, and this has been good for production scheduling so the lack of supply was very disruptive. There is increasing demand in the premium decking range and domestic clear-wood, with many clear-wood lumber producers indicating they can sell everything they can produce. Usually there is a winter drop-off in deck building activity, but this hasn’t yet been noticed.
They feel they may be close to the tipping point with price in many of their European markets. They don’t see much upside as an increase in selling prices may lead to substitution in the market from supply such as African hardwood etc. In many cases the strengthened NZ clear-wood product sells for a higher price than the usually preferred natural Mahogany. A strengthening NZ$ would therefore reduce their margin, as there is little headway to increase price.
The softwood lumber trade dispute between Canada and the US is not expected to affect sales from NZ to the US, as we tend to supply speciality lines that aren’t produced by Canada.
Structural
Supply and demand seem to be well balanced around NZ. Structural mills report that their markets haven’t changed much recently.
Demand from the NZ market is very stable although there is a bit of gamesmanship between the larger suppliers over the expected price rise last month. Any price increase is indicated well in advance (usually 3 months) and at the last minute one of the major suppliers decided to try and increase market share by delaying the price increase and/or maybe not even implementing the full increase. There are still some gamesmanship to play out in this market, but the underlying demand is strong.
The Australian structural market is still relatively flat. There is still a bit of activity in the Queensland region, but there is stiff competition for supply into this market.
The demand from the Pacific Island’s remains steady.
The demand from China is ‘going crazy” and will take everything NZ can produce, although still at ridiculously low margins. This market is very price sensitive but at least there is a margin there now. The afore mentioned softwood lumber trade dispute between Canada and the US may see increased Canadian lumber volume arriving in China, but the China market demand is expected to be sufficient to adsorb this increase.
Export Log Market
China
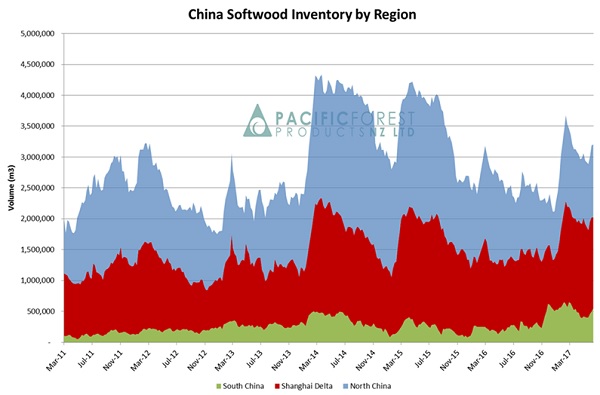
Pacific Forest Products (PFP) reports that China daily offtake is still around 50,000-55,000 m3 per day and that the market remains well-balanced with total log inventory now at 3.2-3.5 million m3 and stable. This inventory has increased from 3 million m3 over the last few weeks due to many workers in northern China returning to harvest family crops in the countryside. There is also the rainy season in Southern China slowing down plywood production. Exporters don’t expect much market movement in the short term. One comment was “I’m certainly not lying awake at night thinking about the China market”. Everyone in the industry hopes this stability continues for a long time yet.

China Log Inventory (Courtesy of PFP)
India
The Indian log market has struggled to maintain parity with the China market over the last five or so months, as it suffered from the effects of demonetization and the introduction of import taxes etc. We mentioned in last month’s Wood Matters that there were early signs of a recovery in this market. This recovery has continued and the Indian log market has approached parity with the China market. The strengthening of the Indian rupee has improved the situation for Indian importers. Most market commentators now expect some well needed stability for this market.
Ocean Freight
The ocean freight prices range from steady to a slight softening in price. The expected increase in the weight factors of logs as we move into the winter month has placed a small upward pressure on actual shipping costs.
Foreign Exchange
The NZD relative to the USD has risen from 0.6880 mid-May to 0.7233 in mid-June. This movement alone reduces the At Wharf Gate (AWG) return by NZ$8.83/m3 for A Grade 3.8m with an average sale price of US$128. How much this affects July AWG prices will depend upon FX hedging strategies and shipping costs of the various exporters.
PF Olsen Log Price Index to June 2017
The PF Olsen Log Price Index for June has dropped one dollar from the record May figure and is now at $126. The index is now $9 higher than the two-year average, $15 above the three year average and $17 higher than the five-year average.

Basis of Index: This Index is based on prices in the table below weighted in proportions that represent a broad average of log grades produced from a typical pruned forest with an approximate mix of 40% domestic and 60% export supply.
Indicative Average Current Log Prices – June 2017
| Log Grade | $/tonne at mill | $/JAS m3 at wharf | ||||||||
| Jun-17 | May-17 | Apr-17 | Mar-17 | Feb-17 | Jun-17 | May-17 | Apr-17 | Mar-17 | Feb-17 | |
| Pruned (P40) | 188 | 188 | 188 | 187 | 187 | 180 | 180 | 185 | 179 | 185 |
| Structural (S30) | 112 | 113 | 113 | 112 | 112 | |||||
| Structural (S20) | 104 | 103 | 103 | 102 | 102 | |||||
| Export A | 141 | 141 | 136 | 137 | 135 | |||||
| Export K | 133 | 134 | 129 | 130 | 128 | |||||
| Export KI | 125 | 126 | 121 | 121 | 119 | |||||
| Pulp | 50 | 50 | 50 | 50 | 50 | |||||
Note: Actual prices will vary according to regional supply/demand balances, varying cost structures and grade variation. These prices should be used as a guide only..
This article is reproduced from PF Olsen's Wood Matters, with permission.


We welcome your comments below. If you are not already registered, please register to comment
Remember we welcome robust, respectful and insightful debate. We don't welcome abusive or defamatory comments and will de-register those repeatedly making such comments. Our current comment policy is here.