Despite continued high shipping costs, small but consistent log price increases in China meant At Wharf Gate (AWG) prices in New Zealand rose by about NZ$6 per JASm3. CFR log prices in China rose about US$6 per JASm3 through June and these price increases are expected to continue in July. Log inventory levels in China continue to fall slowly but steadily, while daily log demand remains steady at 70k m3 per day.
Domestic demand for logs remains weak as we continue through the New Zealand winter.
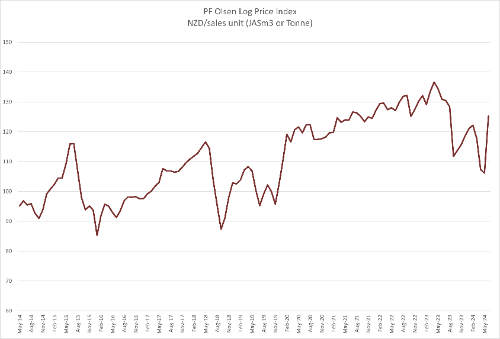
The PF Olsen Log Price Index increased from $113 to $116 in June. This is $3 below the two-year and three-year averages, and $4 below the five-year average.
Domestic Log Market
The total value of building work undertaken in New Zealand in Quarter 1 was 8.4b NZD. This is only down 1% compared to the same quarter last year. However, due to significant cost inflation the actual total decrease in the volume of work undertaken will be higher than 1%. We await the Quarter 2 figures, but market participants expect a further drop.
Many mills have reduced their output of structural lumber in particular, and there is no indication of demand improving during Quarter 3.
Export Log Markets
China
China log inventory continues to reduce slowly, and daily port off-take remains around 70k per day. The average sale price for A grade pine logs in China increased through June from 116 to 122 USD per JASm3. Exporters expect modest increases in log prices through July.
The China Caixin Manufacturing PMI increased in June to 51.7 from 51.4 in May. (Any number above 50 signals manufacturing growth. This is the seventh consecutive month of expansion in factory activity and the fastest pace since June 2022. Input costs rose to the highest level since October last year. Output costs increased as companies passed on their rising costs to clients.
The value of China’s exports rose by 7.6% in May compared with the previous year. This is a positive sign for steady log demand. However, ongoing slow construction activity means the demand level will remain capped below previous high levels. Steel exports of 9.6 million tonnes was the highest monthly total since 2016, albeit at a declining average sale price. Slow domestic construction meant many steel producers looked abroad for markets due to the weak domestic demand for steel.
India
Log Volume to India from Uruguay is still constrained due to adverse weather events in Uruguay. The market anticipates two to three log vessels per month which is a significant reduction from the usual six log vessels per month. Log supply from New Zealand continues to make up this shortfall.
The availability of space aboard container vessels is a serious concern for Indian exporters to Europe and USA. Red sea disruptions and congestion at container hub ports has caused a capacity crunch, with many routes from India sold out for July. This will reduce the demand for timber that is used to make pallets for exporting goods.
Exchange rates
Despite some fluctuation, the strength of the NZD against the USD at the latter part of June is similar to the end of May, so unlikely to have any effect on July AWG prices.
NZD:USD
CNY:USD
Ocean Freight
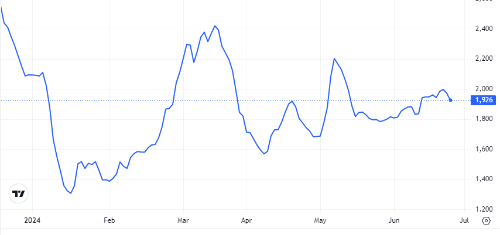
Ocean freight remains high with shipping from the South Island still above 40 USD per JASm3 while shipping from the North Island is in the high 30’s per JASm3. The BDI below is a composite of three sub-indices, each covering a different carrier size: Capsize (40%), Panamax (30%), and Supramax (30%). It displays an index of the daily USD hire rates across 20 ocean shipping routes. Whilst most of the NZ log trade is shipped in Handysize vessels, this segment is strongly influenced by the BDI.
Baltic Dry Index (BDI)
Source: TradingEconomics.com
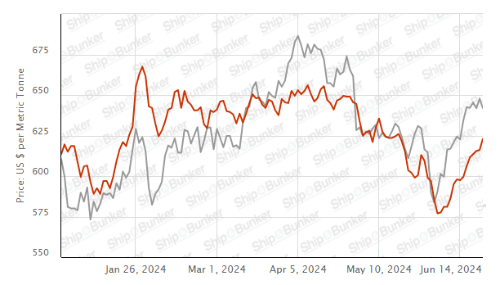
Singapore Bunker Price (VLSO) (red line) versus Brent Oil Price (grey line)
Source: Ship & Bunker
PF Olsen Log Price Index - June 2024

Basis of Index: This Index is based on prices in the table below weighted in proportions that represent
a broad average of log grades produced from a typical pruned forest with an
approximate mix of 40% domestic and 60% export supply.
Indicative Average Current Log Prices – June 2024
| Log Grade | $/tonne at mill | $/JAS m3 at wharf | ||||||||||
| Jun-24 | May-24 | Apr-24 | Mar-24 | Feb-24 | Jan-24 | Jun-24 | May-24 | Apr-24 | Mar-24 | Feb-24 | Jan-24 | |
| Pruned (P40) | 175-200 | 175-200 | 175-200 | 175-200 | 175-200 | 175-200 | 180 | 170 | 170 | 185 | 196 | 196 |
| Structural (S30) | 120-145 | 120-145 | 120-145 | 120-145 | 122-145 | 122-145 | ||||||
| Structural (S20) | 93-100 | 93-100 | 93-100 | 93-100 | 94-100 | 94-100 | ||||||
| Export A | 114 | 108 | 108 | 128 | 135 | 135 | ||||||
| Export K | 105 | 99 | 99 | 119 | 126 | 126 | ||||||
| Export KI | 96 | 90 | 90 | 110 | 117 | 117 | ||||||
| Export KIS | 87 | 81 | 81 | 101 | 108 | 108 | ||||||
| Pulp | 46 | 46 | 46 | 46 | 46 | 46 | ||||||
Note: Actual prices will vary according to regional supply/demand balances, varying cost structures and grade variation. These prices should be used as a guide only.
A longer series of these prices is available here.
Log Prices
Select chart tabs
This article is reproduced from PF Olsen's Wood Matters, with permission.
3 Comments
Concern about low number of tree planting, nz herald article, can't link on phone.
We've got some logs due about now I think, or maybe next year, I'll need to check. Looks like it could be a 3-4 fold investment. Wish we had more now.
What's the saying about the best time to plant trees, about 20 years ago?


We welcome your comments below. If you are not already registered, please register to comment
Remember we welcome robust, respectful and insightful debate. We don't welcome abusive or defamatory comments and will de-register those repeatedly making such comments. Our current comment policy is here.