At Wharf Gate (AWG) log prices dropped an average of 7-10 NZD in March. This was mainly due to increased freight costs with some slight drops in log sale prices in China. There is an oversupply of logs in China and CFR log prices have fallen about 12% in late March. Reduced shipping costs and a weaker NZD against the USD will alleviate some of the pain for New Zealand forest owners, but AWG prices will fall substantially in April. This situation won’t change until log supply from New Zealand is substantially reduced.
Domestic log prices are stable with log pricing set for Quarter 1.
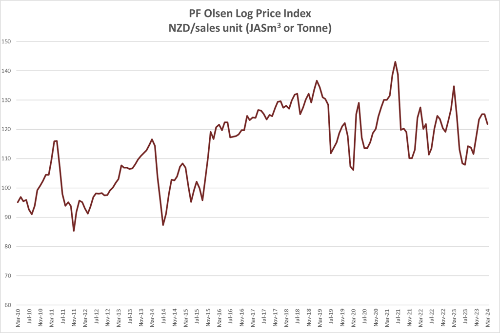
The PF Olsen Log Price Index dropped $3 in March to $122. This is $2 above the two-year average, level with the three-year average, and $1 above the five-year average.
Domestic Log Market
Applications for consents to build new residences in New Zealand continue to decline. StatsNZ information showed consents were issued for 37,000 new residences in the year to December 2023, down 25% from the 49,538 consents issued in 2022. 2022 was a record high, but the slow-down is actually more pronounced than the numbers indicate. Industry commentators suggest only 80% of current consents will likely lead to construction in the short term compared with the previous number of 95% of consents leading to construction.
Export Log Markets
China
China log inventory has increased to over 4m m3 with New Zealand radiata pine accounting for about 3.4m m3. Daily off-take is now back to 60k which means there is over two months of inventory in China. While log demand in China was slow to rebuild after the Lunar New Year holiday period, daily usage of 60k is what the average was over last year. However, log exporters from New Zealand don’t seem to understand the relationship between price and the supply curve. The sale price for A grade pine logs in China remained stable in February in the 128-132 USD range. But even as supply was exceeding demand and inventory was building through March, one exporter was still trying to price A grade at 136 per JASm3 but had to settle for 116 USD per JASm3. Even worse is that forest owners didn’t slow supply down.
Good weather meant harvest volumes were high in New Zealand and there is usually an increase in volume before the wetter autumn weather arrives.
Log demand in China is relatively constant so the only correction to the current situation will be a reduction in log supply. We will have to wait and see how long this takes and what log prices will be achieved during this time.
The China Caixin Manufacturing PMI increased from 50.8 in January to 50.9 in February. (Any number above 50 signals manufacturing growth). Output rose the most since May 2023, new order growth accelerated, and foreign sales expanded at the strongest pace in a year. However, firms cut their selling prices for the second month in a row in an effort to stimulate demand.
Demand in Kandla for green sawn timber is steady at INR 571 and INR 601 per CFT from timber from South America and Australian pine logs respectively.
A log vessel will load in New Zealand in early April to arrive in Kandla in early May. Planning is underway for a couple of additional log vessels from New Zealand as log exporters seek alternatives to the constrained China log market.
However, the market expects about five log vessels from South America to arrive in May and the market may be oversupplied if more vessels are loaded from NZ to Kandla. One advantage for New Zealand is that the Indian log buyers prefer our pine logs.
In Tuticorin, pine log supplies from the USA are erratic due to adverse weather and the Red Sea issues. Some containers are arriving from Australia and New Zealand with radiata pine logs. Green sawn timber is sold in the range INR 650 to 700 per CFT.
With the Indian Parliamentary Elections scheduled between April 19th and June 1st, many saw mill workers have returned to their villages to cast their vote and for agricultural harvest work. They can return by mid-June, when the election results will be declared.
Market sentiment is that the demand for pine wood will increase in Quarter 3, as many new infrastructure projects will be implemented by the new Union Government, so that India's GDP surpasses USD 35 trillion by 2047.
Housing sales in Quarter 1 in India (across the top seven cities) increased 14% compared with housing sales in Quarter 1 2023 and are at decade high levels.
Exchange rates
The NZD has weakened against the USD through March, and this will partially offset some of the weaker log prices during April AWG calculations.

NZD:USD

CNY:USD
Ocean Freight
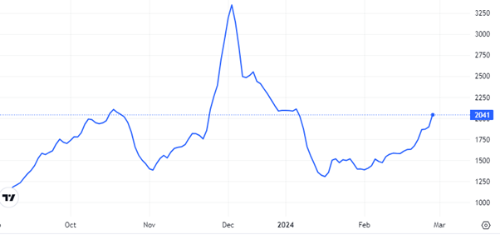
Freight costs achieved for April log exports are on average 5 USD lower than current prices, so the recent price increased seem to have reversed. The Baltic Dry Index below is a composite of three sub-indices, each covering a different carrier size: Capsize (40%), Panamax (30%), and Supramax (30%). It displays an index of the daily USD hire rates across 20 ocean shipping routes. Whilst most of the NZ log trade is shipped in Handysize vessels, this segment is strongly influenced by the BDI.

Source: TradingEconomics.com

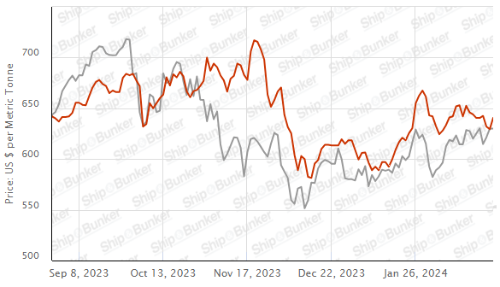
Singapore Bunker Price (VLSO) (red line) versus Brent Oil Price (grey line)
Source: Ship & Bunker
PF Olsen Log Price Index – March 2024
The PF Olsen Log Price Index dropped $3 in March to $122. This is $2 above the two-year average, level with the three-year average, and $1 above the five-year average.

Basis of Index: This Index is based on prices in the table below weighted in proportions that represent
a broad average of log grades produced from a typical pruned forest with an
approximate mix of 40% domestic and 60% export supply.
Indicative Average Current Log Prices – March 2024
| Log Grade | $/tonne at mill | $/JAS m3 at wharf | ||||||||||
| Mar-24 | Feb-24 | Jan-24 | Dec-23 | Nov-23 | Oct-23 | Mar-24 | Feb-24 | Jan-24 | Dec-23 | Nov-23 | Oct-23 | |
| Pruned (P40) | 175-200 | 175-200 | 175-200 | 175-200 | 175-200 | 175-200 | 185 | 196 | 196 | 190 | 180 | 180 |
| Structural (S30) | 120-145 | 122-145 | 122-145 | 120-145 | 120-145 | 120-145 | ||||||
| Structural (S20) | 93-100 | 94-100 | 94-100 | 93-100 | 93-100 | 93-100 | ||||||
| Export A | 128 | 135 | 135 | 134 | 125 | 119 | ||||||
| Export K | 119 | 126 | 126 | 125 | 116 | 110 | ||||||
| Export KI | 110 | 117 | 117 | 116 | 107 | 101 | ||||||
| Export KIS | 101 | 108 | 108 | 107 | 98 | 92 | ||||||
| Pulp | 46 | 46 | 46 | 46 | 46 | 46 | ||||||
Note: Actual prices will vary according to regional supply/demand balances, varying cost structures and grade variation. These prices should be used as a guide only.
A longer series of these prices is available here.
Log Prices
Select chart tabs
This article is reproduced from PF Olsen's Wood Matters, with permission.

We welcome your comments below. If you are not already registered, please register to comment
Remember we welcome robust, respectful and insightful debate. We don't welcome abusive or defamatory comments and will de-register those repeatedly making such comments. Our current comment policy is here.