There were mixed signals from the China log market at the end of 2023, but January At Wharf Gate (AWG) prices for export logs in New Zealand increased slightly from December AWG prices.
Domestic log prices were stable with some small price increases for structural logs.
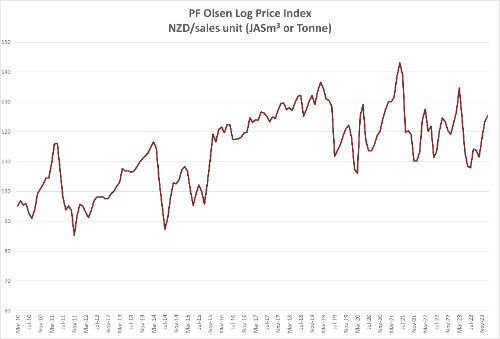
The PF Olsen Log Price Index increased $2 to $125. The index is currently $5 above the two-year average, $3 above the three-year average, and $4 above the five-year average.
Domestic Log Market
Many sawmills in New Zealand took longer end-of-year breaks than usual. Sales of decking material this summer are higher than last summer, but still below the longer term average sale figures. Domestic sales of structural and outdoor products have picked up from last year but sawmillers are still wary of sale figures in the winter months ahead. Many sawmillers expect sales similar to last year as interest rates remain high.
Sales of sawn timber into Australia are okay, but sales of clear sawn timber into Europe remain low, and it is unlikely demand will increase during the European winter.
Domestic log prices are stable with some small increases in structural logs in the Central North Island and Southland regions.
China
China softwood log inventory is stable but daily port off-take has started to reduce in preparation for the Chinese Lunar New Year. Daily offtake is now around 55k m3 per day. Many sawmills across China are taking a longer break than normal this year. The sale price for A grade pine logs in China remained stable in January within the 127-130 USD range. Some log exporters have asked for price increases for February sales.
By the end of December China wholesale log prices had reduced by approximately 60 RMB per m3 (6%) from the peak (when sawmillers had a minor panic that log supply would not keep up with demand). However, wholesale prices have risen 25% since mid-June and finished the year slightly above 2022 price levels.
The China Caixin Manufacturing PMI increased from 50.7 in November to 50.8 in December. (Any number above 50 signals manufacturing growth). Output grew the most in seven months and new orders rose at the fastest pace since February.
A Hong Kong based court has ordered the liquidation of property developer China Evergrande Group which initially defaulted on its debts in 2021. The court appointed Alvarez & Marsal as the liquidator. This default contributed to the property sector entering into a downward spiral at that time. The market expects this liquidation will have little immediate effect on construction and log demand. It will likely be a drawn-out process for an offshore liquidator to take control of Evergrande’s operations across mainland China.
India
Red Sea disruption has increased Europe to India container freight rates, resulting in kiln died sawn timber prices increasing by up by 30 Euro per m3.
This has increased kiln dried sawn timber prices at Gandhidham by 100 INR per CFT. South American green sawn timber is sold at 541 INR per CFT and Australian radiata pine sawn timber is sold at 571 INR per CFT.
Import log CIF prices are up at Kandla, both in ship loads and containers. Sawn timber demand is picking up as CIF prices are increasing.
Three vessels have been declared from Uruguay and one from Argentina, for February shipment and March arrival at Kandla.
Indian Parliamentary elections are expected in April. Government orders for construction that will require timber may reduce once Indian Election Commission announces the model code of conduct. However, demand will pick up in May once the new ministry is formed, as many new infrastructure projects will be finalised and announced.
Tuticorin is facing log supply shortages, due to disruption from South Africa because of Methyl-bromide phasing out and Red Sea freight surcharges for southern yellow pine logs from USA. The price for green sawn timber is around 650 INR per CFT.
Exchange rates
The NZD has weakened against the USD through January, and this will assist with the February AWG log prices.

NZD:USD

CNY:USD
Ocean Freight
Usually there is a softening in freight costs just prior to the Chinese New Year as there is a reduction in global shipping demand. This price reduction has not occurred this year and freight costs remain about, or just over, 30 USD per JASm3 to ship logs from the North Island of New Zealand to China.
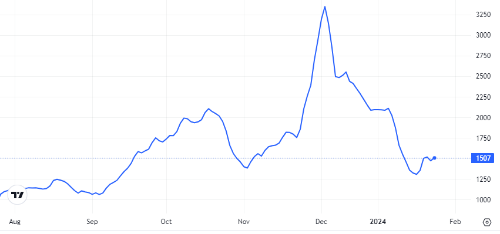
The Baltic Dry Index (BDI( below is a composite of three sub-indices, each covering a different carrier size: Capsize (40%), Panamax (30%), and Supramax (30%). It displays an index of the daily USD hire rates across 20 ocean shipping routes. Whilst most of the NZ log trade is shipped in Handysize vessels, this segment is strongly influenced by the BDI.

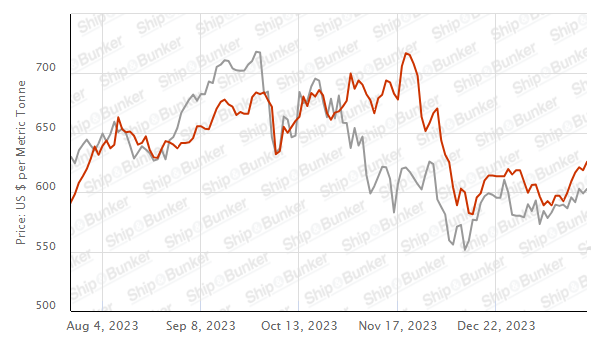
Singapore Bunker Price (VLSO) (red line) versus Brent Oil Price (grey line)
Source: Ship & Bunker
PF Olsen Log Price Index – January 2024
The PF Olsen Log Price Index increased $2 to $125. The index is currently $5 above the two-year average, $3 above the three-year average, and $4 above the five-year average.

Basis of Index: This Index is based on prices in the table below weighted in proportions that represent
a broad average of log grades produced from a typical pruned forest with an
approximate mix of 40% domestic and 60% export supply.
Indicative Average Current Log Prices – January 2024
| Log Grade | $/tonne at mill | $/JAS m3 at wharf | ||||||||||
| Jan-24 | Dec-23 | Nov-23 | Oct-23 | Sep-23 | Aug-23 | Jan-24 | Dec-23 | Nov-23 | Oct-23 | Sep-23 | Aug-23 | |
| Pruned (P40) | 175-200 | 175-200 | 175-200 | 175-200 | 175-200 | 175-200 | 196 | 190 | 180 | 180 | 180 | 183 |
| Structural (S30) | 122-145 | 120-145 | 120-145 | 120-145 | 120-145 | 120-145 | ||||||
| Structural (S20) | 94-100 | 93-100 | 93-100 | 93-100 | 93-100 | 93-100 | ||||||
| Export A | 135 | 134 | 125 | 119 | 119 | 120 | ||||||
| Export K | 126 | 125 | 116 | 110 | 110 | 111 | ||||||
| Export KI | 117 | 116 | 107 | 101 | 101 | 102 | ||||||
| Export KIS | 108 | 107 | 98 | 92 | 92 | 93 | ||||||
| Pulp | 46 | 46 | 46 | 46 | 46 | 46 | ||||||
Note: Actual prices will vary according to regional supply/demand balances, varying cost structures and grade variation. These prices should be used as a guide only.
A longer series of these prices is available here.
Log Prices
Select chart tabs
This article is reproduced from PF Olsen's Wood Matters, with permission.


We welcome your comments below. If you are not already registered, please register to comment
Remember we welcome robust, respectful and insightful debate. We don't welcome abusive or defamatory comments and will de-register those repeatedly making such comments. Our current comment policy is here.