September AWG prices for export logs remained similar to August AWG prices at North Island ports while the log exporters reduced AWG prices at the South Island ports. Log demand in China remains at steady levels.
The domestic market shows signs of recovery but the global demand for sawn timber is reducing.
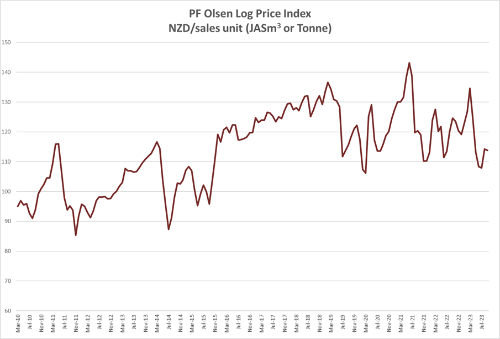
The PF Olsen Log Price Index remains at $114 for September. The index is currently $5 below the two-year average and $8 below the five-year average.
Domestic Log Market
Log supply is getting tight in some regions as smaller forest owners slow down or stop harvest production.
The New Zealand market expects reasonable demand for sawn timber over summer with construction and DIY projects.
Demand in Europe for clear sawn timber boards from New Zealand pine has declined for the first time in a while and sale orders have been drastically reduced. This market has been a stellar performer for New Zealand mills over recent years, so this is a concern. Hopefully this is only a temporary imbalance between supply and demand.
Sawn timber prices continue to fall around the world due to reduced demand. Just like in New Zealand the global demand for sawn timber is very sensitive to interest rates. And especially the perception of increased rates for the foreseeable future. Sawmills in New Zealand are having to adjust to a reduction in the ‘average basket price’ they receive from the products of processing a log.
Export Log Markets
China
China radiata log inventory has reduced to around 2.5 m3. Daily port off-take has remained within the range of 60-70k m3 per day, which is in the normal range for this time of the year in China. The CFR price in China is now in the range 110-115 USD per JASm3 for A grade logs. Market expectations are for around 1.4m m3 of logs arriving from New Zealand in September. This is still slightly less than demand, but the market is not concerned as China approaches its National Day Golden Week of holidays starting 1st October.
Log buyers are becoming more comfortable about the current market but cash and credit are still in short supply. The Chinese government has announced several policies to stimulate property investment and encourage construction activity. Minimum down payment requirements have been reduced to 20% for first home buyers and 30% for second time buyers. Interest rates on new mortgages have been reduced by about 40 percentage points after the central bank set a lower benchmark prime loan rate. While there was an initial increase in the purchase of property, the market still does not have confidence house values will rise making them a good investment. The larger socio-economic issues such as an ageing population and a government still very anti- speculation will continue to constrain the market.
The China Caixin Manufacturing PMI unexpectedly rose from 49.2 in July to 51.0 in August. Any PMI number above 50 signals manufacturing growth. Factory activity had its strongest expansion since February and employment gained for the first time in six months. Foreign sales remain weak due to the growing risk of a global recession. It’s not surprising really when China’s economic growth has contributed 40% of the world’s growth over the last decade.
India
Prices for green sawn timber in Gandhidham are 501 INR per CFT for South American pine and 541 INR per for Australian pine. The volume of pine logs arriving has reduced during September and sawn timber demand is subdued.
Uruguay supplies are tight and the market expects about four vessels from Argentina and Uruguay to arrive during October. About four vessels of Australian radiata pine logs are expected to arrive at Kandla before the end of November.
A new supplier will load about 42,000 JASm3 of New Zealand radiata pine logs around mid October, as underdeck cargo onboard MV Sarika Naree. This shipment ex Bluff and Marsden Point ports is subject to on-arrival methyl-bromide fumigation at Kandla, at the buyers expense. This shipment of logs to India from New Zealand is the first for a couple of years. This shipment is possible due to a temporary window allowed by Indian Plant Quarantine for on-arrival methyl-bromide fumigation, for Bills of Lading dated before 31st October 2023. Regular New Zealand log exporters are taking a wait and see approach.
Exchange rates
The strength of the NZD against the USD towards the end of September is similar to where it was at the end of August. Therefore, the currency will have little impact on October AWG prices. The strength of the CNY against the USD is also similar to where it was a month ago.

NZD:USD

CNY:USD
Ocean Freight
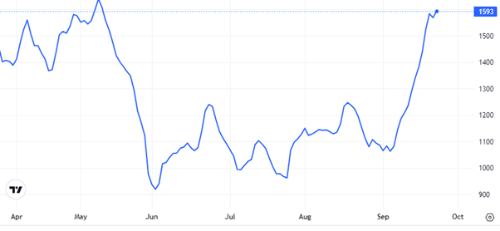
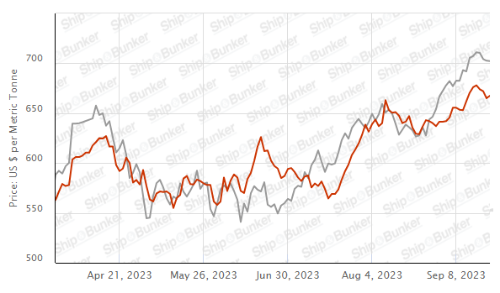
Freight costs continue to increase with a range of low to mid 30’s USD per JASm3 for shipping logs from the North Island of New Zealand to China. The cost differential for South Island shipping always widens compared to the North Island during the New Zealand winter as the logs are heavier. The cost of Supramax vessels have risen faster than that for Handymax vessels. There is also an average ten day waiting time for vessels at Tauranga port. The cost of Supramax vessels from New Zealand is often more volatile than Handymax vessels. The Baltic Dry Index has risen to its highest level since May, and bunker prices continue to rise as well. China’s demand for coal imports has increased this year compared to last year due to reduced domestic coal production and lower hydrothermal energy production. There is more pressure coming on shipping costs from New Zealand.
The Baltic Dry Index (BDI) below is a composite of three sub-indices, each covering a different carrier size: Capsize (40%), Panamax (30%), and Supramax (30%). It displays an index of the daily USD hire rates across 20 ocean shipping routes. Whilst most of the NZ log trade is shipped in Handysize vessels, this segment is strongly influenced by the BDI.

Source: TradingEconomics.com

Singapore Bunker Price (VLSO) (red line) versus Brent Oil Price (grey line)
Source: Ship & Bunker
PF Olsen Log Price Index – September 2023
The PF Olsen Log Price Index remains at $114 for September. The index is currently $5 below the two-year average and $8 below the five-year average.

Indicative Average Current Log Prices – August 2023
| Log Grade | $/tonne at mill | $/JAS m3 at wharf | ||||||||||
| Sep-23 | Aug-23 | Jul-23 | Jun-23 | May-23 | Apr-23 | Aug-23 | Aug-23 | Jul-23 | Jun-23 | May-23 | Apr-23 | |
| Pruned (P40) | 175-200 | 175-200 | 175-200 | 175-200 | 175-200 | 175-200 | 180 | 183 | 150-160 | 150-160 | 160-170 | 180-200 |
| Structural (S30) | 120-145 | 120-145 | 120-145 | 120-145 | 120-150 | 120-150 | ||||||
| Structural (S20) | 93-100 | 93-100 | 93-100 | 93-100 | 98-105 | 98-105 | ||||||
| Export A | 119 | 120 | 105 | 105 | 110 | 133 | ||||||
| Export K | 110 | 111 | 96 | 96 | 101 | 124 | ||||||
| Export KI | 101 | 102 | 89 | 89 | 94 | 115 | ||||||
| Export KIS | 92 | 93 | 80 | 80 | 85 | 107 | ||||||
| Pulp | 46 | 46 | 46 | 46 | 46 | 46 | ||||||
Note: Actual prices will vary according to regional supply/demand balances, varying cost structures and grade variation. These prices should be used as a guide only.
A longer series of these prices is available here.
Log Prices
Select chart tabs
This article is reproduced from PF Olsen's Wood Matters, with permission.

We welcome your comments below. If you are not already registered, please register to comment
Remember we welcome robust, respectful and insightful debate. We don't welcome abusive or defamatory comments and will de-register those repeatedly making such comments. Our current comment policy is here.