At Wharf Gate (AWG) prices for export logs increased $18 per JASm3 (14%) in March. This price increase was due to a shortage of logs to fill ordered vessels. Demand in China has increased but is still well below normal levels for this time of year. Domestic demand for lumber and therefore logs is weakening, and most log processing facilities are operating below capacity.
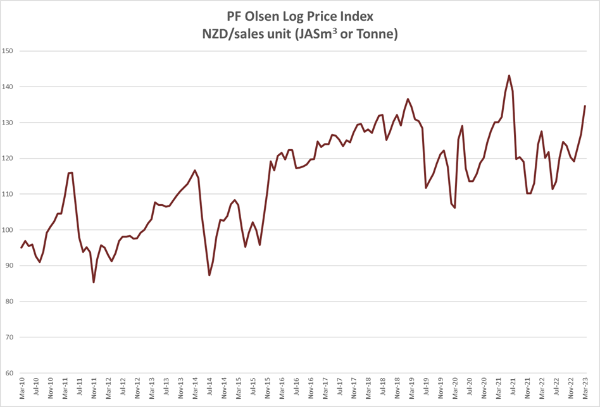
The March PF Olsen Log Price Index increased $8 to $135, which is the highest since July 2021. The index is now $12 above the two-year and $11 above the five-year average.
Domestic Log Market
Most sawmills in New Zealand are operating well below capacity. The structural market in particular seems to be oversupplied. There was a lot of panic ordering and purchasing after the Covid lockdown period when the local supply of timber products and the imported supply of associated building products both had severely constrained supply chains. While the supply of sawn timber has caught up and there are now heavy stocks through the supply chain. Prices have held to date but there is a strong possibility of spot discounting to move product. One positive for New Zealand mills is price increases for sawn timber sales in Asia. Prices in all markets have increased by an average of 7%.
Export Log Market
China
China softwood log inventory is about 4.7-4.8m m3 with radiata accounting for about 3.2m m3. Port off-take has increased to over 80k per day. This is a slightly higher daily offtake than the same time in the last two years. The problem is poor sentiment as the China market was expecting higher log demand.
The CFR price for A grade radiata logs in China is in the range 140-145 USD per JASm3. There is price pressure as wholesale log prices in China have fallen. Wholesale prices for A grade radiata logs in Lan Shan have dropped from 970 to about 920 RMB in the last month. Spruce logs that had maintained their wholesale price when the price for radiata had dropped 5% in February, have now fallen significantly in the last two weeks from over 1200 RMB to below 1100 RMB per m3.
Log buyers are also struggling to open Letters of Credit (LCs). Hopefully, this situation will improve as China has freed-up approximately 500b CNY (72b USD) by cutting its Reserve Requirement Ratio (RRR) to 7.6%. This is an attempt to stimulate the China market, so it can achieve a GDP growth target of 5% that was announced at the National People’s Congress in early March. China achieved 3% growth last year. The IMF reports that China has achieved this target in the first two months of 2023, and predicts China will achieve GDP growth of 5.2 this year.
The China Caixin manufacturing PMI increased 2.4 points in February to 50.6. The index is above the significant level of 50 for the first time in seven months. (A reading above 50 indicates an expansion of the manufacturing sector). Sentiment also improved to a 23-month high as markets expect the recovery in consumer demand to be sustained.
This general positivity in China markets does not seem to be manifesting in the construction industry. China generally is battling with a drop in productivity and this may be even more pronounced in the construction industry where state-owned companies have started to replace private companies. There is often a productivity gap between state-owned enterprises and private companies.
India
Price rises for sawn timber in India have stagnated as their exports are down. This means reduced demand for timber packaging products etc. Exports from India in February 2023 fell 8.8% compared with February 2022. The manufacturing sector is weak with reduced demand due to high inflation and rising interest rates. The construction industry in India is also weak.
Exchange rates
The NZD dropped 4% against the USD through February. This allowed log exporters to increase the March AWG prices in NZD. Conversely, the CNY has recently stabilised against the USD.

NZD:USD

CNY:USD
Ocean freight
Shipping costs have increased, especially for the Supramax vessels more so than the Handymax vessels. Most Handymax shipping rates from New Zealand are in the mid 130’s USD per JASm3 with Supramax shipping rates at least 10 USD higher. The versatility of the Supramax while having the larger DWT than the Handymax means they are in more demand due to the increased global shipping demand with other products.
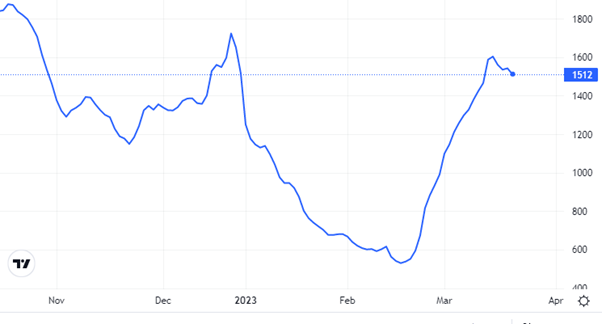
The Baltic Dry Index (BDI) is a composite of three sub-indices, each covering a different carrier size: Capsize (40%), Panamax (30%), and Supramax (30%). It displays an index of the daily USD hire rates across 20 ocean shipping routes. Whilst most of the NZ log trade is shipped in Handysize vessels, this segment is strongly influenced by the BDI.

Source: TradingEconomics.com

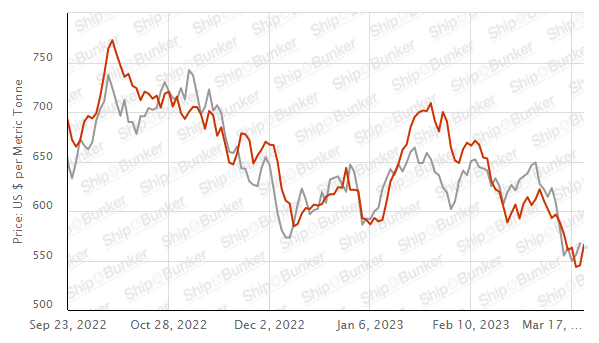
Singapore Bunker Price (VLSO) (red line) versus Brent Oil Price (grey line)
Source: Ship & Bunker
PF Olsen Log Price Index - March 2023
The March PF Olsen Log Price Index increased $8 to $135, which is the highest since July 2021. The index is now $12 above the two-year and $11 above the five-year average.

Please note these are AWG prices at North Island ports and that South Island prices are commonly lower due to higher port and shipping costs.
Basis of Index: This Index is based on prices in the table below weighted in proportions that represent a broad average of log grades produced from a typical pruned forest with an approximate mix of 40% domestic and 60% export supply.
Indicative Average Current Log Prices – March 2023
| Log Grade | $/tonne at mill | $/JAS m3 at wharf | ||||||||||
| Mar-23 | Feb-23 | Dec-22 | Nov-22 | Oct-22 | Sep-22 | Mar-23 | Feb-23 | Dec-22 | Nov-22 | Oct-22 | Sep-22 | |
| Pruned (P40) | 175-200 | 175-200 | 175-200 | 175-200 | 175-200 | 175-200 | 200-222 | 190-205 | 175-190 | 190-200 | 190-200 | 190-200 |
| Structural (S30) | 120-150 | 120-150 | 120-150 | 120-150 | 120-150 | 120-150 | ||||||
| Structural (S20) | 98-105 | 98-105 | 98-105 | 98-105 | 98-105 | 98-105 | ||||||
| Export A | 158 | 140 | 125 | 126 | 133 | 135 | ||||||
| Export K | 149 | 131 | 115 | 117 | 124 | 126 | ||||||
| Export KI | 130 | 121 | 106 | 109 | 116 | 118 | ||||||
| Export KIS | 131 | 113 | 100 | 101 | 110 | 112 | ||||||
| Pulp | 46 | 46 | 46 | 46 | 46 | 46 | ||||||
Note: Actual prices will vary according to regional supply/demand balances, varying cost structures and grade variation. These prices should be used as a guide only.
A longer series of these prices is available here.
Log Prices
Select chart tabs
This article is reproduced from PF Olsen's Wood Matters, with permission.
2 Comments
Does anyone have any guides or papers written to understand the forestry/logging industry in NZ? I've been trying to figure out why we do very little wood processing domestically but I really haven't been able to find a good answer.
Have a read of this report. High tariffs and non tariff barriers on processed lumber. Low tariffs of logs. NZ produces far more logs than it can use domestically. Similar to Fonterra - small domestic market, significant player in global log trade.

We welcome your comments below. If you are not already registered, please register to comment
Remember we welcome robust, respectful and insightful debate. We don't welcome abusive or defamatory comments and will de-register those repeatedly making such comments. Our current comment policy is here.