The At Wharf Gate (AWG) prices for export logs increased an average of $6 in March. Reduced log supply to China has maintained price increases, but increasing shipping costs, a strengthening NZD and other external factors mean an increased downside risk for AWG prices in New Zealand.
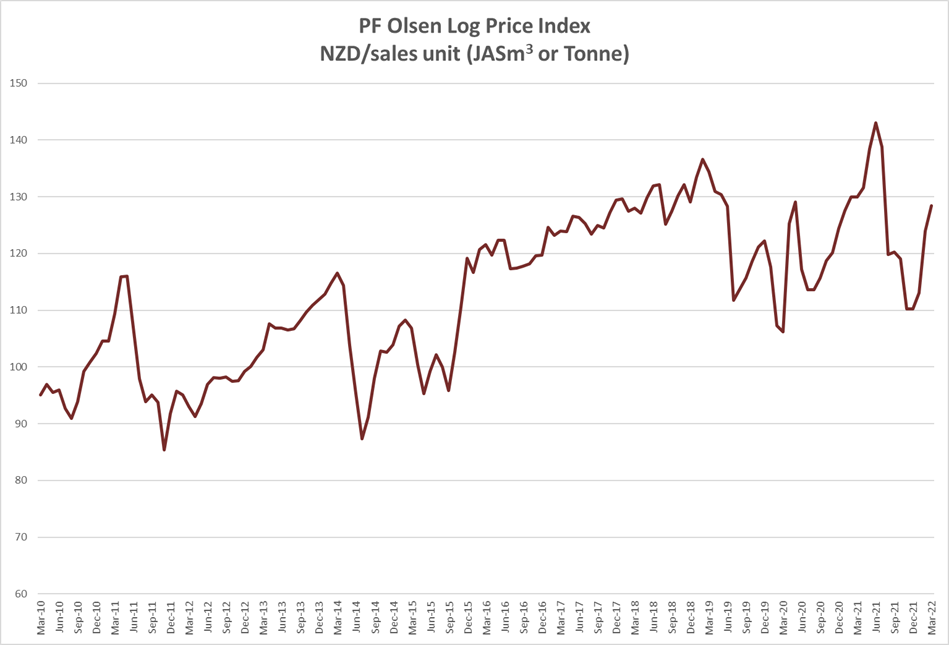
The PF Olsen log price index increased $4 in March to $128 which is $5 above the two-year average, $7 above the three year-average and $4 above the five-year average.
Domestic Log Market
Log Supply and Pricing
While log supply has been disrupted by Covid and wet weather there has been sufficient log supply for domestic mills. Pricing is relatively unchanged as we finish the quarter.
Sawn Timber Markets
Increasing interest rates and costs have not affected demand for sawn timber. The wholesale prices for sawn timber have increased across the range of products with an average 5-7% increase and up to 12% for clear sawn timber. As is usual in the New Zealand market most price increases take effect after a three-month notice period.
Export Log Market
China
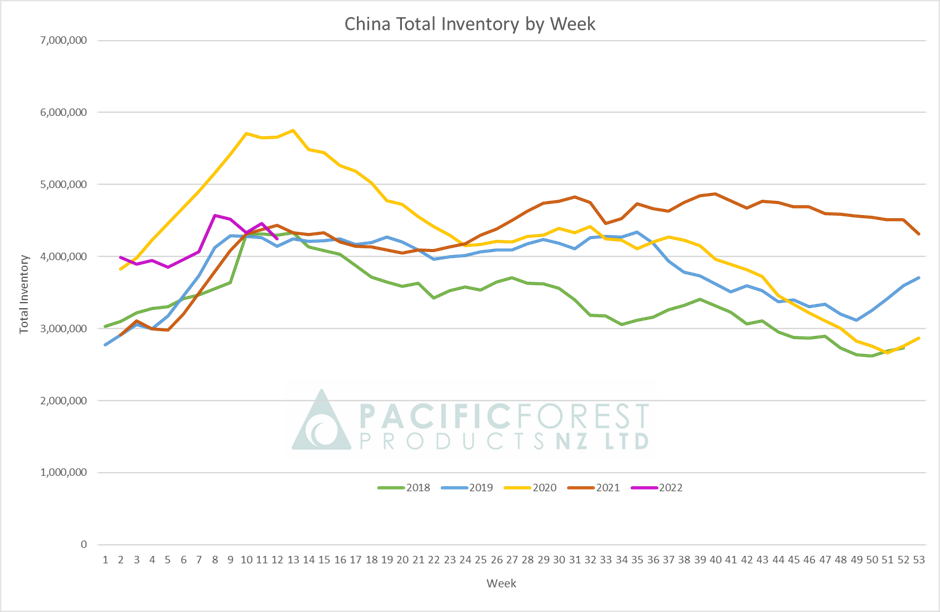
The price for logs in China has risen steadily through Quarter 1 with the price for A-grade logs now at 177 USD per JAS m3. The inventory of pine logs at the 23 main log ports in China has been stable despite a below-average daily offtake of 65k m3 per day.
Log supply has been constrained with less supply from both New Zealand and Europe. In January 2022, log supply by value to China from New Zealand was down 40% compared with January 2021 supply. This was due to many crews taking extended breaks over the New Zealand Christmas /New Year Holiday period. Even with increasing AWG prices through Quarter 1 in New Zealand, many forest owners are still limiting production levels or not starting new jobs until they see consistency in the AWG pricing. March is traditionally a big month for log production in New Zealand due to good weather, good log prices and a high amount of workdays (23 this year). Due to interruptions in the supply chain caused by Covid absences and weather events, log production will also be lower than expected this March.
Other factors reducing supply will be Uruguayan exporters dealing with increased ocean freight costs, and a reduction in European log supply due to Russia invading Ukraine. While we will likely see an increase in Russian lumber supply (and possibly even logs despite an earlier ban of export logs) this would take time to ramp up, while the reduction from the rest of Europe is more immediate. European supply was already reducing before the war, due to falling salvage harvest levels and increased internal processing and consumption.
The graph below from PFP shows that inventory levels are within the normal range for this time of year.

While the China log market is ticking along, there is a concern about the lingering effects of the financial crisis in the real estate industry as well as the effect of mass lockdowns as China continues an elimination strategy for Omicron. Currently, the reduced supply is maintaining price pressure in the China log market. However, if any demand reduction exceeds the reduction in supply, then this price pressure will disappear.
India
Log supply from Uruguay has dwindled with exporters switching to supply the China market. There is only one vessel loaded in March but two in April. Prices for sawn timber in Kandla has increased to 641 INR and 681 INR per CFT for timber from Uruguay pine and Australian green lumber respectively.
Tuticorin in Southern India continues to face log shortages due to the ongoing container shortage. Sawn timber prices have increased again to above 750 INR per CFT. The price for sawn timber price in Chennai is now at 800 INF per CFT.
Exchange rates
The NZD has strengthened against the USD over this year. This has limited AWG price increases for New Zealand forest owners. The CNY has weakened against the USD reducing the buying power of Chinese log buyers. Chinese log traders are likely to be lining-up bargain purchases in Russian rubles (RUB).

NZD: USD

CNY: USD
Ocean Freight
76,442 (4%) of the merchant fleet workers in the world are Ukrainian. Many of these workers may have returned home to defend their homeland. This reduction in labour as well as other supply chain disruptions due to Covid and the Russian invasion of Ukraine have increased concern for global supply chains.
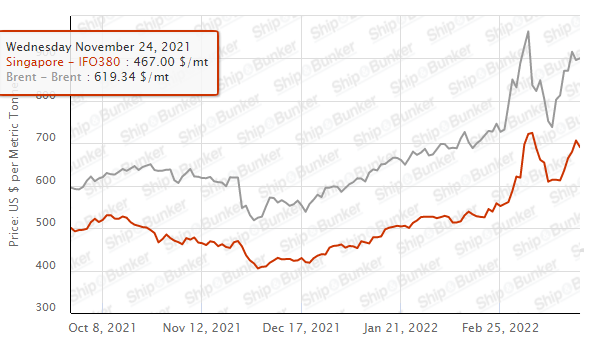
Oil is a major cost component in ocean freight cost and has been extremely volatile during March. In early March the price of Brent crude peaked near US$130/barrel before dipping to below 100 USD and is now back to US$120/barrel. Increased uncertainty has also contributed to sharply rising freight costs. Log exporters are preparing for 80 USD shipping rates from New Zealand to China. These increased costs will likely reduce supply from Uruguay to China where there is approximately 40 sailing days as opposed to 18 sailing days from New Zealand.

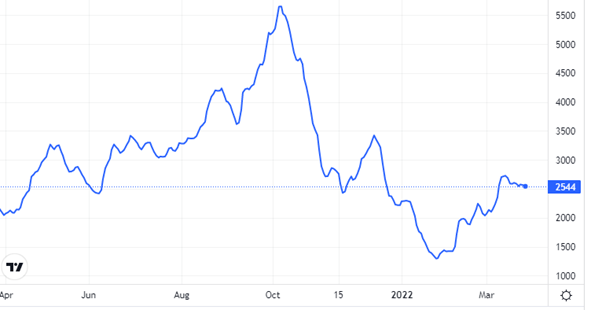
Source: TradingEconomics.com
The Baltic Dry Index (BDI) is a composite of three sub-indices, each covering a different carrier size: Capesize (40%), Panamax (30%), and Supramax (30%). It displays an index of the daily USD hire rates across 20 ocean shipping routes. Whilst most of the NZ log trade is shipped in handy size vessels, this segment is strongly influenced by the BDI.

Singapore Bunker Price (IFO380) (red line) versus Brent Oil Price (grey line)
Source: Ship & Bunker
PF Olsen Log Price Index – March 2022
The index of $128 is $5 above the two-year average, $7 above the three year-average and $4 above the five-year average.

Basis of Index: This Index is based on prices in the table below weighted in proportions that represent a broad average of log grades produced from a typical pruned forest with an approximate mix of 40% domestic and 60% export supply.
Indicative Average Current Log Prices – March 2021
| Log Grade | $/tonne at mill | $/JAS m3 at wharf | ||||||||||
| Mar-22 | Feb-22 | Dec-21 | Nov-21 | Oct-21 | Sep-21 | Mar-22 | Feb-22 | Dec-21 | Nov-21 | Oct-21 | Sep-21 | |
| Pruned (P40) | 180-200 | 180-200 | 180-200 | 180-200 | 180-200 | 180-200 | 150-160 | 150-160 | 150-160 | 150-160 | 194-200 | 194-200 |
| Structural (S30) | 120-155 | 120-155 | 120-155 | 120-155 | 120-155 | 125-160 | ||||||
| Structural (S20) | 100-105 | 100-105 | 100-105 | 100-105 | 100-105 | 105-110 | ||||||
| Export A | 141 | 141 | 108 | 108 | 126 | 128 | ||||||
| Export K | 132 | 132 | 99 | 99 | 118 | 120 | ||||||
| Export KI | 125 | 125 | 90 | 90 | 114 | 113 | ||||||
| Export KIS | 117 | 117 | 82 | 82 | 105 | 104 | ||||||
| Pulp | 46 | 46 | 46 | 46 | 46 | 46 | ||||||
Note: Actual prices will vary according to regional supply/demand balances, varying cost structures and grade variation. These prices should be used as a guide only.
A longer series of these prices is available here.
Log Prices
Select chart tabs
This article is reproduced from PF Olsen's Wood Matters, with permission.

We welcome your comments below. If you are not already registered, please register to comment
Remember we welcome robust, respectful and insightful debate. We don't welcome abusive or defamatory comments and will de-register those repeatedly making such comments. Our current comment policy is here.