
The At Wharf Gate (AWG) prices for export logs in July decreased an average of $8-9 per JASm3 from June prices. There was a wide range of prices depending upon location as demurrage costs in Gisborne due to port congestion affected AWG log prices. There were also different market strategy approaches by log exporters with their AWG pricing.
The combination of the usual drop in productivity in China during their hottest months was exacerbated by the Chinese government forcing some sawmills to relocate from Taicang, Jiangsu Province.
The Indian log market is showing signs of recovery with a shortage of logs anticipated in Tuticorin. The demand for logs and sawn timber in New Zealand has not reduced during the winter period.
The PF Olsen Log Price Index reduced $4 from the June record of $143 to $139. The index is currently $16 above the two-year average, and $14 above the three and five-year averages.
Domestic Log Market
Log Supply and Pricing
Log supply has been sufficient for mills through winter and prices are stable to increasing depending upon the region and where the prices sat relative to the export equivalent.
Sawn Timber Markets
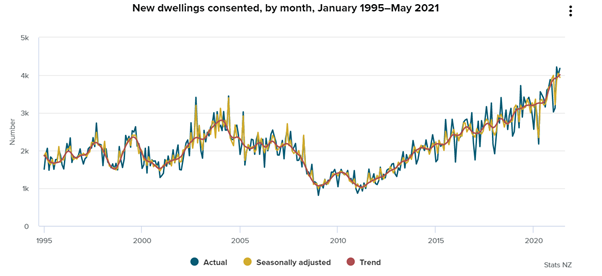
There has been no slowing in demand for log and sawn timber during the winter months in New Zealand. Consents for new dwellings in New Zealand continues its upward trend. New dwelling consents are graphed below. Consents to the end of May show an annual increase of 17% by number and 21% by value from the previous year. This is very pronounced in the North Island where consents in Auckland were up 28% and the rest of the North Island was up 24%. Canterbury was up 13% while the rest of the South Island was down 4%.
Export Log Market
AWG prices
The AWG prices for July dropped an average of $8-$9 per JASm3 around the country. There was a larger drop in Gisborne where ships are now having to queue for over a month before berthing. These demurrage costs are being passed along to the forest owner with lower AWG pricing. This has also recently started to affect Tauranga where vessel waiting times have moved out to 10 days. If the vessel waiting times do not improve this will affect August AWG prices.
China
The price for A grade logs was in the mid 190’s range for June and early July shipments. There is now a standoff between the log exporters and Chinese log buyers with LC’s not signed at 185 USD per m3 for A grade.
Softwood log inventory has risen to about 5.5m m3 and daily port off-take has dropped to around 60k m3 per day. While this drop in offtake was expected due to the hot sticky weather in China, the offtake over the last three years has dropped to only about 75k per day in July. (Last year was an anomaly due to the severe floods in China). In each of these years demand and log prices increased through quarter 4.
Many log processing facilities in Taicang will have to close or relocate after the government with very little warning, effected regulation in early July that will restrict sawmilling to specific identified industrial districts. Initial estimates are this will reduce milling capacity by about 50%. Taicang was China’s second largest port for softwood imports and received about 20% of China’s total softwood imports. Taicang is only just over 50km north-west of Shanghai so the regulations are likely to be a combination of government wanting to repurpose the land as well as reduce pollution. This land will most likely be repurposed for housing or higher tech companies. (Interestingly, Taicang is the hub for over 250 German companies in China).
We have seen similar occurrences in China previously and these have disrupted the log market in the short-term but have had no long-term effect. In 2018 under the Governments “Three Year Plan on Defending the Blue Sky”, over 3,000 wood-based panel enterprises in Hebei Province were told to stop production and undertake refurbishment or relocate. In 2019, Shenzhen’s’ local government decided to move the sawmills away to utilise the land for other industries.
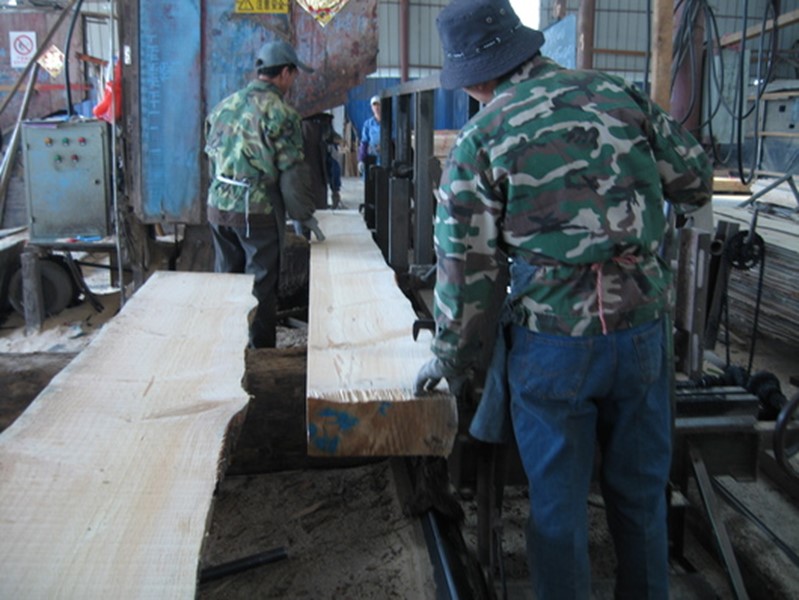
Sawmilling in Taicang
Log demand in China usually ramps up after the golden holiday week at the start of October. At the same time there will still likely be constrained supply for several reasons:
- Australia has moved away from needing to export logs to China.
- Supply from Uruguay will likely have slowed down considerably if log prices have dropped in China making this supply chain untenable.
- Warmer weather in Europe’s spring has meant the bark beetle infestation is less than usual this year, so wood salvaged from storm damage won’t need to be harvested and utilised as quickly allowing for more domestic processing in countries like Germany. The Czech Republic does not have a significant sawmilling industry so will most likely continue to export most of their logs.
- Russia will start to prepare for their ban on exporting logs in 2022.
Log prices are likely to increase through quarter 4 as supply struggles to keep up with demand.
India
Kandla is expected to receive one ship each from Uruguay and Australia in August. Six vessels are expected to arrive in September, as five from Uruguay and one from Australia are likely to be loaded in August. The sawn timber price in Kandla is weak at INR 601 per CFT.
Fire damaged pine logs exported in containers from Australia to Mundra port is near zero. Log quality within specifications has been very variable.
A log shortage is anticipated in Tuticorin in September, as shipping liners are citing congestion and not providing containers to Indian ports. In South Africa, the Durban riots have made many shippers count their losses and has also displaced shipments. In the Tuticorin market sawn timber prices have risen to around INR 700 per CFT.
European pallet grade sawn timber is quoted at a wide range of EUR 275 to 400 CFR in Tuticorin. The price depends on whether the sale is in stock lots or cut to order sizes. Some Indian log importers plan to experiment using cheaper poplar logs from Europe for pallet making.
Exchange rates
The NZD weakened against the USD over June dropping from 0.7277 to 0.6982 against the USD. This reduced the drop in AWG pricing for July.

NZD:USD

CNY:USD
Ocean Freight
Shipping costs to China have crept up to above 60 USD per m3 from North Island ports. The Baltic Dry Index was sitting at 1200 in November and is now at 3059. Demurrage costs caused by congestion in Gisborne and more recently in Tauranga will add significantly to exporters costs.
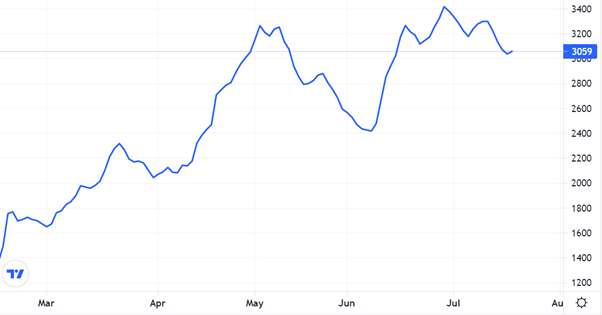
Source: TradingEcnomics.com
The Baltic Dry Index (BDI) is a composite of three sub-indices, each covering a different carrier size: Capesize (40%), Panamax (30%), and Supramax (30%). It displays an index of the daily USD hire rates across 20 ocean shipping routes. Whilst most of the NZ log trade is shipped in handy size vessels, this segment is strongly influenced by the BDI.
The Singapore Bunker Price has continued to edge upward.
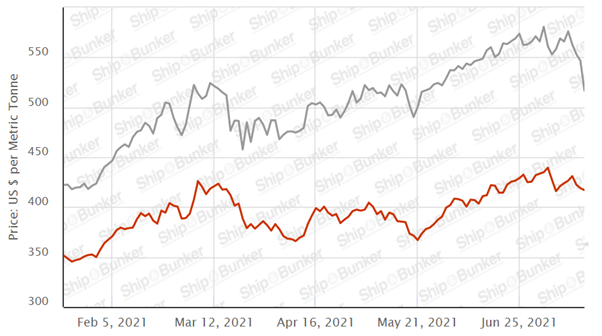
Singapore Bunker Price (IFO380) (red line) versus Brent Oil Price (grey line)
Source: Ship & Bunker
PF Olsen Log Price Index – July 2021
The PF Olsen Log Price Index reduced $4 from the June record of $143 to $139. The index is currently $16 above the two-year average, and $14 above the three and five-year averages.
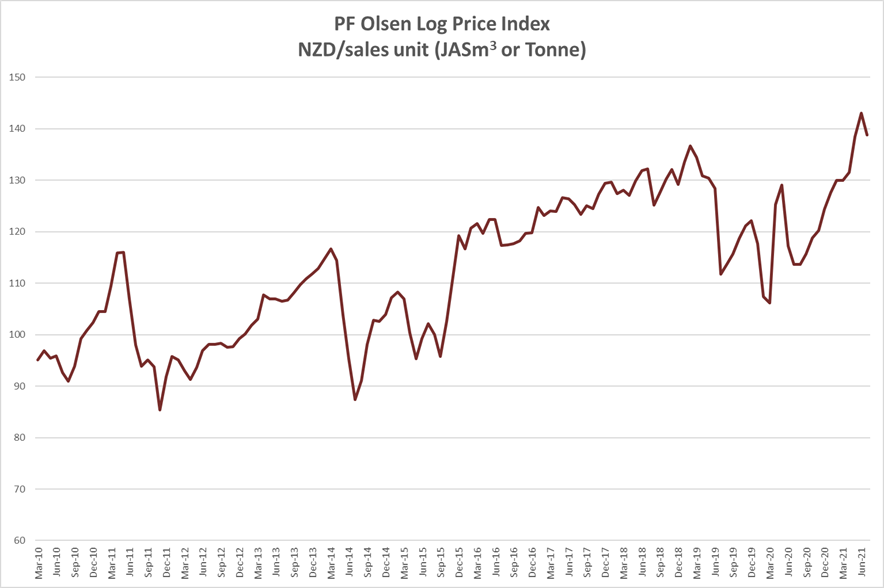
Basis of Index: This Index is based on prices in the table below weighted in proportions that represent a broad average of log grades produced from a typical pruned forest with an approximate mix of 40% domestic and 60% export supply.
Indicative Average Current Log Prices – July 2021
| Log Grade | $/tonne at mill | $/JAS m3 at wharf | ||||||||||
| Jul-21 | Jun-21 | May-21 | Apr-21 | Mar-21 | Feb-21 | Jul-21 | Jun-21 | May-21 | Apr-21 | Mar-21 | Feb-21 | |
| Pruned (P40) | 180-200 | 180-200 | 175-195 | 175-195 | 175-195 | 175-195 | 194-200 | 204-218 | 200-214 | 184-192 | 180-190 | 180-190 |
| Structural (S30) | 125-160 | 125-160 | 125-139 | 122-136 | 118-132 | 118-132 | ||||||
| Structural (S20) | 109 | 109 | 109 | 108 | 108 | 108 | ||||||
| Export A | 163 | 171 | 165 | 150 | 148 | 148 | ||||||
| Export K | 156 | 164 | 158 | 142 | 140 | 140 | ||||||
| Export KI | 147 | 154 | 150 | 134 | 134 | 134 | ||||||
| Export KIS | 137 | 146 | 142 | 125 | 125 | 125 | ||||||
| Pulp | 46 | 46 | 46 | 46 | 46 | 46 | ||||||
Note: Actual prices will vary according to regional supply/demand balances, varying cost structures and grade variation. These prices should be used as a guide only.
A longer series of these prices is available here.
Log Prices
Select chart tabs
This article is reproduced from PF Olsen's Wood Matters, with permission.
3 Comments
logs are this and logs are that
whats the price $m/2 ex frame and truss plant?
pretty even if the association has done its job
cartel??
logs are this and logs are that
whats the price $m/2 ex frame and truss plant?
pretty evan if the association has done its job
cartel??
This article is about log prices ex forest as in a commodity. If you want to know retail timber prices ring your local timber merchant. Or you could buy a log and deal with it your self.

We welcome your comments below. If you are not already registered, please register to comment
Remember we welcome robust, respectful and insightful debate. We don't welcome abusive or defamatory comments and will de-register those repeatedly making such comments. Our current comment policy is here.