
Despite a strengthening NZD, the At Wharf Gate (AWG) prices for export logs in May increased an average of $13 per JASm3 from April prices. Log demand in China is outpacing supply with the Chinese construction activity now above pre-Covid levels. The Chinese government which had stimulated the economy post Covid-19, has signalled an intention to take the heat out of the commodities market.
The PF Olsen Log Price Index increased $6 to a record $138 in May. The index is currently $18 above the two-year average, and $14 above the three and five-year averages.
Domestic Log Market
Log Supply and Pricing
Log prices were relatively unchanged as prices are predominantly fixed for Quarter 2. There is plenty of log supply for local mills with relatively good weather as autumn concludes in New Zealand.
Sawn Timber Markets
The domestic demand for sawntimber in all grades has remained strong with no discernible drop in demand in autumn or forward orders in winter.
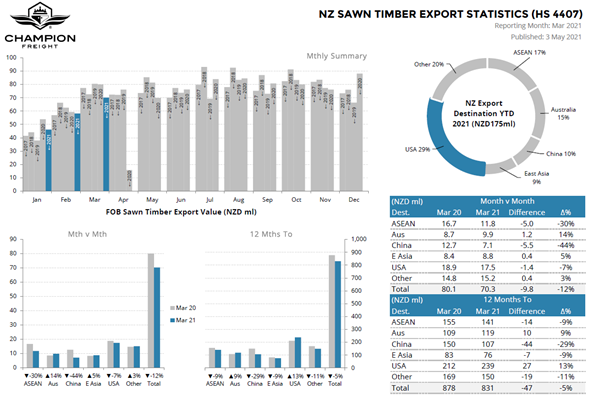
While recent export sales from New Zealand mills have been at very high prices, the export volumes through Quarter 1 are still down on the previous year. More volume has been retained for the domestic market. You can see the Covid-19 affected sales figure for April 2020.
Source: Champion Freight
Export Log Market
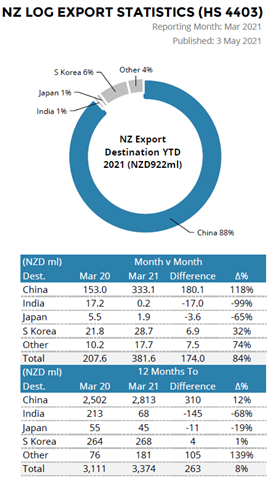
The below graph from Champion Freight displays the increase in log supply to China and the decline in sales to India.
AWG Prices
The scope of the increases in export log prices surprised everyone. When the log prices reach this level the supply chain can get quite stretched with a lack of capacity to keep up with the demand.
China
The price for A grade logs at the start of May was about 183 USD per JASm3. In mid-May the prices are now around 185 USD per JASm3. The rate of increase in log prices has slowed with some mills in China now struggling with the higher log prices. Chinese peeling factories are struggling to afford imported logs and are either changing to domestic eucalypt or poplar species, or in some cases smaller factories are shutting down production.
Softwood log inventory has stabilised at around 4.2-4.3m which is positive as many expected stocks to increase as China had the May Day holidays. Daily port off-take is around 70-80k m3 per day.
New bank loans in China fell more than expected in April and money supply growth slowed to a 21- month low. The State Council (China’s cabinet) announced on 12th May that it would monitor changes in overseas and domestic markets and effectively cope with the fast increases in commodity prices. China will step up coordination between monetary and other policies to maintain stable economic operations.
While the heat may be taken out of the log market there is unlikely to be a crash in log prices as supply is still constrained. There is unlikely to be an increase in log supply from Europe until more containers become available. North America is in a building boom and has it’s own shortage of logs and sawn timber. In the short-to-medium term, there is little chance of supply relief from Australia following their recent withdrawal from the Belt and Road deal with China. That deal was intended to (amongst other things) encourage Chinese infrastructure companies to invest in Australia. The withdrawal will further damage an already fractured relationship.
Construction activity generally slows down in China from June as they enter the hotter months. This will be partially offset with reduced harvest volumes in the New Zealand winter. Eastland Port will also undertake extensive port maintenance during June that will reduce port loading hours by about 20%.
India
The log market in Kandla is operating at about 30% of total capacity as they deal with Covid-19. Many other states in India are in complete lockdown.
Exchange rates
Through April the NZD strengthened against the USD which reduced the May AWG prices by about $5-6 NZD. The CNY also strengthened against the USD, which assisted the Chinese log buyers purchasing logs in USD.

NZD:USD

CNY:USD
Ocean Freight
Ocean freight rates to China have climbed to over $50 USD again from the North Island ports. The Chinese government’s announcement that it will take as yet unspecified measures to reduce the heat in the commodities market may reduce shipping demand. There is however still strong demand for bulk shipping of non-commodity items, including items that were previously shipped in containers.
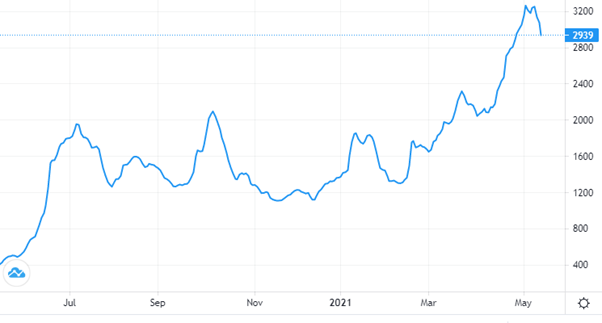
The Baltic Dry Index was sitting at 1200 in November and is now at 2939.
Source: TradingEconomics.com
The Baltic Dry Index (BDI) is a composite of three sub-indices, each covering a different carrier size: Capesize (40%), Panamax (30%), and Supramax (30%). It displays an index of the daily USD hire rates across 20 ocean shipping routes. Whilst most of the NZ log trade is shipped in handy size vessels, this segment is strongly influenced by the BDI.
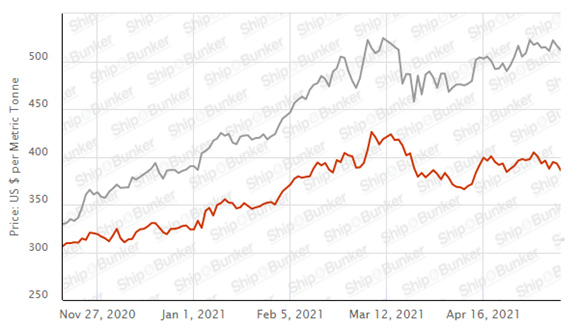
Singapore Bunker Price (IFO380) (red line) versus Brent Oil Price (grey line)
Source: Ship & Bunker
PF Olsen Log Price Index – May 2021
The PF Olsen Log Price Index increased $6 to a record $138 in May. The index is currently $18 above the two-year average, and $14 above the three and five-year averages.
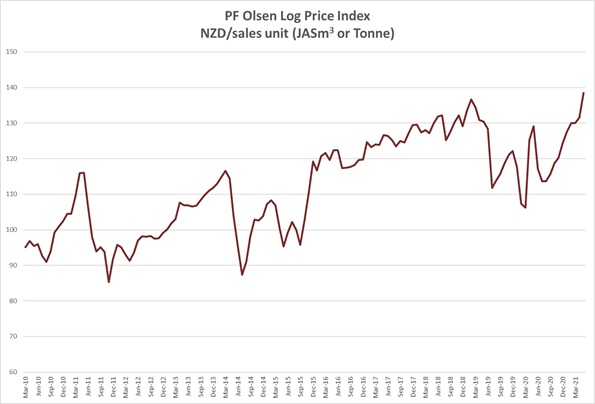
Basis of Index: This Index is based on prices in the table below weighted in proportions that represent a broad average of log grades produced from a typical pruned forest with an approximate mix of 40% domestic and 60% export supply.
Indicative Average Current Log Prices – May 2021
| Log Grade | $/tonne at mill | $/JAS m3 at wharf | ||||||||||
| May-21 | Apr-21 | Mar-21 | Feb-21 | Dec-20 | Nov-20 | May-21 | Apr-21 | Mar-21 | Feb-21 | Dec-20 | Nov-20 | |
| Pruned (P40) | 175-195 | 175-195 | 175-195 | 175-195 | 170-195 | 170-195 | 200-214 | 184-192 | 180-190 | 180-190 | 170-185 | 170-185 |
| Structural (S30) | 125-139 | 122-136 | 118-132 | 118-132 | 115-130 | 115-130 | ||||||
| Structural (S20) | 109 | 108 | 108 | 108 | 105 | 105 | ||||||
| Export A | 165 | 150 | 148 | 148 | 138 | 130 | ||||||
| Export K | 158 | 142 | 140 | 140 | 131 | 122 | ||||||
| Export KI | 150 | 134 | 134 | 134 | 120 | 113 | ||||||
| Export KIS | 142 | 125 | 125 | 125 | 115 | 105 | ||||||
| Pulp | 46 | 46 | 46 | 46 | 46 | 46 | ||||||
Note: Actual prices will vary according to regional supply/demand balances, varying cost structures and grade variation. These prices should be used as a guide only.
A longer series of these prices is available here.
Log Prices
Select chart tabs
This article is reproduced from PF Olsen's Wood Matters, with permission.

We welcome your comments below. If you are not already registered, please register to comment
Remember we welcome robust, respectful and insightful debate. We don't welcome abusive or defamatory comments and will de-register those repeatedly making such comments. Our current comment policy is here.