
March AWG prices remained the same as February prices. Increased shipping costs for logs to China was mostly covered by increased CFR sale prices.
There was little movement in domestic log prices as we come to the end of Quarter 1.
April AWG prices will be determined by the relative rises of log prices and shipping costs, while currency movement will also have an impact.
The PF Olsen Log Price Index remained at $130 in March due to the stable AWG prices. The index is currently $10 above the two-year average, $6 above the three-year average, and $6 above the five-year average.
Domestic Log Market
Log Supply and Pricing
The odd mill has reported a shortage of log supply, but this is location specific. There has been no significant price movement with prices locked in for the quarter.
Sawn Timber Markets
At the risk of sounding boringly repititive demand remains very strong for sawn timber in New Zealand with mills struggling to keep up with orders.
Prices for export sawn timber continue to increase in New Zealand export markets. The prices for sawn timber in China have increased faster than the log prices.
Export Log Market
China
The CFR prices for New Zealand pine logs in China has increased approximately 5 USD over the last month and is still increasing. The price for A grade logs is now around 158 USD per JASm3 and log exporters will continue to ask for increased pricing to compensate for increased shipping costs. Steady increases in log prices this year have been achievable to date as wholesales are still making a margin.
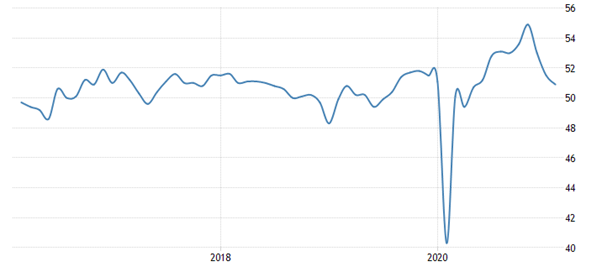
Softwood log inventory has climbed to 4.6m m3 as volume continued to arrive while China restarted after the Chinese New Year period. Daily port off-take is currently a healthy 70k and increasing weekly. The China Caixin Manufacturing PMI fell to 50.9 in February. This is a relatively neutral score which predicts minimal change in manufacturing. While output and new work eased the PMI was also affected by raw material shortages and transport delays increasing suppliers’ delivery times. (Suppliers’ delivery times makes up 15% of the PMI). Business sentiment strengthened with future output expectations jumping to the second highest since August 2014.
China Caixin manufacturing PMI
India
The Kandla log market is improving with April shipment indicative pricing for A grade of 165 USD for Australian logs and 175 USD for New Zealand logs. March shipments from Uruguay sold for an average of $140 USD for A grade. As explained further in the shipping section of this report, Uruguay is now targeting larger vessels for China. The average price for sawn timber in Kandla has increased to 501 INR per ft3.
Pine logs will be in short supply in Tuticorin due to the lack of containers. The price of a container from Australia to Tuticorin is reported to be over $100 USD per m3.
Exchange rates
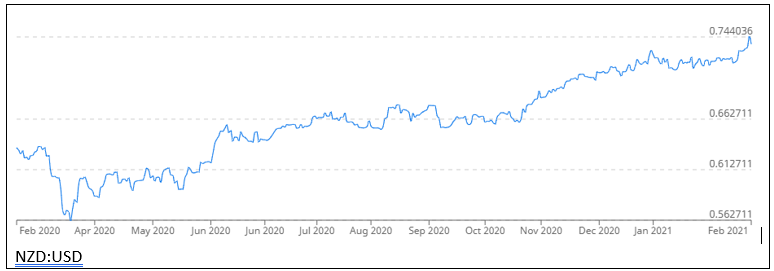
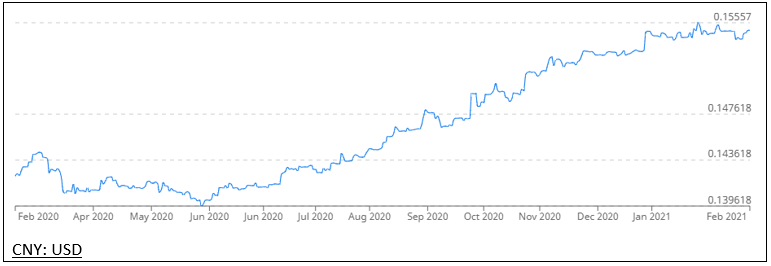
The NZD has strengthened against the USD since November, while the CNY has strengthened against the USD since June.
Ocean Freight
Ocean freight rates from North Island ports to China are now above 50 USD per JASm3 and expected to increase another $5 USD in May. Shipping costs from some South Island ports are as high as mid 60’s.
Due to increasing costs and delays in the container supply chain, cargo that had been shipped for decades in containers is now transported via break bulk. This de-containerisation has occurred in many products including fertiliser, feed, chemicals, sawn timber, and plywood cargo. One exporter noted going breakbulk was two and half times cheaper than current prices for containerized cargo between China and Europe. These exporters expect to ship the cargo in breakbulk for the next three to four months. This increase in demand for break bulk has been particularly noticed in the often more versatile Handy-size vessel that New Zealand log exporters utilise.
Log exporters from Uruguay are looking at options to utilise the much larger Cape-size vessels to alleviate the rapidly escalating shipping costs. The first vessel arising from this strategy is expected to load 90,000 JASm3 bound for China. This is not an option for New Zealand log exporters due to their minimum draft requirement exceeding the maximum available at New Zealand ports.
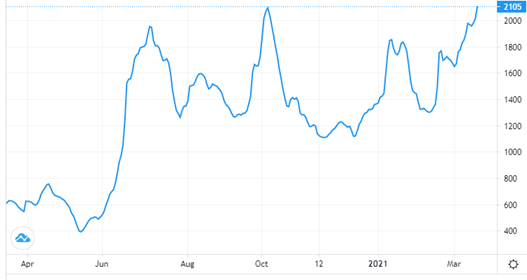
The Baltic Dry Index was sitting at 1200 in November and is now at 2105.
Source: TradingEconomics.com
The Baltic Dry Index (BDI) is a composite of three sub-indices, each covering a different carrier size: Capesize (40%), Panamax (30%), and Supramax (30%). It displays an index of the daily USD hire rates across 20 ocean shipping routes. Whilst most of the NZ log trade is shipped in handy size vessels, this segment is strongly influenced by the BDI.
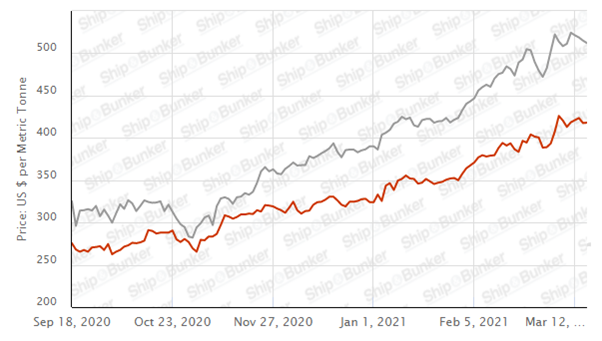
Singapore Bunker Price (IFO380) (red line) versus Brent Oil Price (grey line)
Source: Ship & Bunker
PF Olsen Log Price Index – March 2021
The PF Olsen Log Price Index remained at $130 in March as there was no price movement. The index is currently $10 above the two-year average, $6 above the three-year average, and $6 above the five-year average.
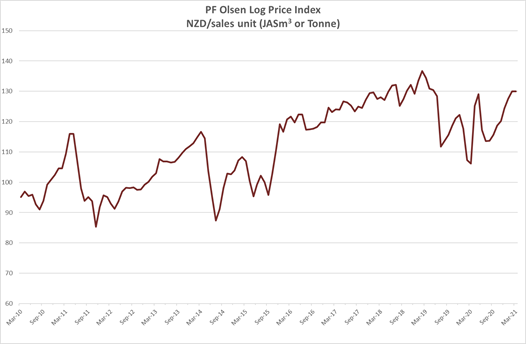
Basis of Index: This Index is based on prices in the table below weighted in proportions that represent a broad average of log grades produced from a typical pruned forest with an approximate mix of 40% domestic and 60% export supply.
Indicative Average Current Log Prices – March 2021
| Log Grade | $/tonne at mill | $/JAS m3 at wharf | ||||||||||
| Mar-21 | Feb-21 | Dec-20 | Nov-20 | Oct-20 | Sep-20 | Mar-21 | Feb-21 | Dec-20 | Nov-20 | Oct-20 | Sep-20 | |
| Pruned (P40) | 175-195 | 175-195 | 170-195 | 170-195 | 170-195 | 170-200 | 180-190 | 180-190 | 170-185 | 170-185 | 165-175 | 155-165 |
| Structural (S30) | 118-132 | 118-132 | 115-130 | 115-130 | 115-130 | 110-120 | ||||||
| Structural (S20) | 108 | 108 | 105 | 105 | 105 | 105 | ||||||
| Export A | 148 | 148 | 138 | 130 | 128 | 123 | ||||||
| Export K | 140 | 140 | 131 | 122 | 120 | 115 | ||||||
| Export KI | 134 | 134 | 120 | 113 | 112 | 106 | ||||||
| Export KIS | 125 | 125 | 115 | 105 | 104 | 97 | ||||||
| Pulp | 46 | 46 | 46 | 46 | 46 | 46 | ||||||
Note: Actual prices will vary according to regional supply/demand balances, varying cost structures and grade variation. These prices should be used as a guide only.
A longer series of these prices is available here.
Log Prices
Select chart tabs
This article is reproduced from PF Olsen's Wood Matters, with permission.
3 Comments
'Business sentiment strengthened with future output expectations jumping to the second highest since August 2014. '
I'm not sure that there is any straightforward correlation between business expectations in China and log prices for NZ, but going by the graphs given, there was at least a year's delay between the second highest reading in August 2014 and the start of the upswing in log prices (Dec 2015?).
Prices are high now but very volatile. So maybe a more solid upwards trend in log prices starting May 2022?
You are looking at demand, but between 2014 and now there is a big difference in log supply. Softwood log supply from Russian has reduced dramatically since then and may stop completely next year if Russia does follow through on their ban.
Well here's hoping that the price is maintained for the longer term then and that exports from other countries continue to be somewhat restrained by the various limiting factors applying now, but that price does not reach a short term peak that brings on extra long term supply.
Your log reports are excellent, always informative and I look forward to them.

We welcome your comments below. If you are not already registered, please register to comment
Remember we welcome robust, respectful and insightful debate. We don't welcome abusive or defamatory comments and will de-register those repeatedly making such comments. Our current comment policy is here.