
Domestic demand for logs and sawn timber remains strong with domestic sales of sawntimber exceeding projections.
The November AWG prices for export grade logs increased by 1-2 NZD per JASm3 from October prices. Market indicators for New Zealand logs in China are very good with solid demand, reducing inventory levels, and reduced supply from other countries. Log stocks will likely build in a quiet India with increased log supply.
Due to the increase in export log prices the PF Olsen Log Price Index increased by $1 in November to $120. The index is currently $1 below the two-year average, $4 below the three-year average, and $3 below the five-year average.
Domestic Log Market
Log Supply and Pricing
Some regions in the North Island have a surplus supply of pruned logs while there is a shortage of good construction logs in some parts of the South Island where forest owners and managers have moved harvesting crews to tidy-up wind damaged or burnt forests. The logs produced from these forests do not produce sawn timber suitable for use in domestic construction.
Sawn Timber Markets
The domestic market for sawntimber across all product ranges is very strong. Some mill managers referred to the market as “cranking along”. Many mills report record levels of production and that many of their customers now have longer term forward orders for their services and products. This has previously been the case for private orders with strong DIY and house construction, and there are now longer-term orders for commercial sales as well. Some mill managers say they now have an issue finding enough trucks and drivers to deliver their products.
The strengthening NZD against the USD has reduced revenue from export sales. Mill owners and managers have medium to long term concerns about cheaper sawntimber products from Europe (spruce), Russia and China.
Export Log Market
The CFR prices have increased for New Zealand pine logs due to solid demand, reduced supply, and lower inventory levels. The price for A grade New Zealand pine is currently around 123 USD per JASm3 and expected to increase for December deliveries.
Softwood log inventory in China has reduced by approximately 17% over the last month to 3.6m m3.
Daily log use in China is now back to the 100k to 105k m3 range after peaking at over 120k m3 at the end of October.
The CAIXIN manufacturing PMI index rose to 53.6 in October. This shows the sector remains healthy. (A PMI above 50 indicates expansion and 53.6 is the highest since January 2011).
China has banned logs from the Australian states of Queensland and Victoria, stating they have detected live pests. The supply chain for spruce from Europe has increased in cost due to an increase in container costs. The price for new arrivals of spruce has increased to 110 EUR.
The longer-term supply situation may be beneficial for New Zealand logs with forecasts that 2021 will be the peak of spruce availability from Europe and a proposed Russian ban on export logs starting in January 2022.
India
Manufacturing and construction will be relatively quiet in India until late November due to the Diwali festival. Economists suggest this may be the most important Diwali festival in over 10 years. Consumption makes up 60% of the GDP in India, and an economic revival in India requires an increase in consumer spending which usually occurs in the festive season. The Diwali season usually accounts for 25-40% of all domestic sales of consumer durables.
Log supply will likely increase as log volume from Queensland that would have been sold in China has been diverted to Kandla in break bulk and Tuticorin in containers. This is additional to the regular two-three vessels from Uruguay and two vessels from New Zealand per month. Some volume from Uruguay may be sent to China if China log prices continue to lift faster than Indian prices.
Kandla lumber prices are steady at INR 471 levels. Log and lumber demand are forecast to increase after the Diwali period.
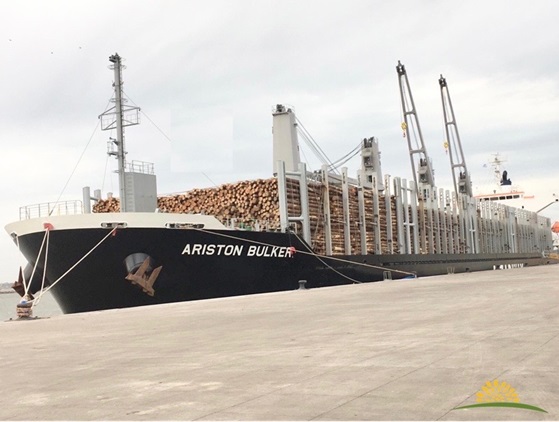
29,771 JASm3 of Pinus taeda bound for India from Montevideo, Uruguay. (Courtesy of TGL Uruguay).
Exchange rates
The NZD was relatively stable during October but has increased against the USD in the first half of November. The CNY has continued to strengthen against the USD increasing the buying power of the Chinese log buyers.
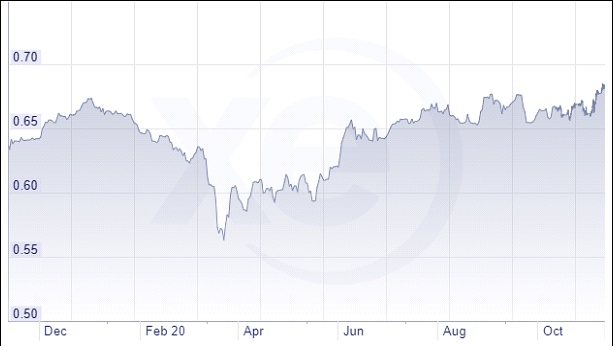
NZD:USD
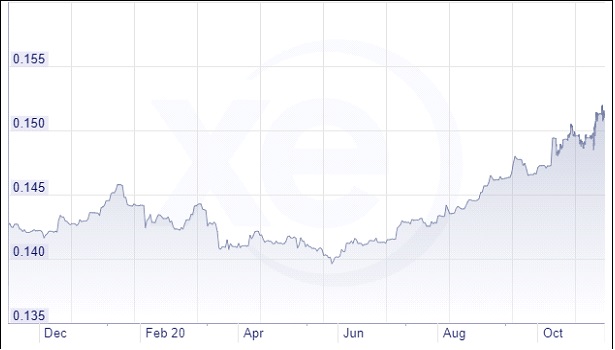
CNY: USD
Ocean Freight
The average ocean freight rate has remained relatively unchanged with some minor increases over the last month.
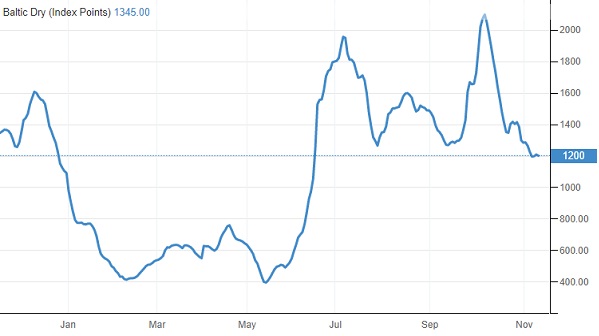
Source: TradingEconomics.com
The Baltic Dry Index (BDI) is a composite of three sub-indices, each covering a different carrier size: Capesize (40%), Panamax (30%), and Supramax (30%). It displays an index of the daily USD hire rates across 20 ocean shipping routes. Whilst most of the NZ log trade is shipped in handy size vessels, this segment is strongly influenced by the BDI.
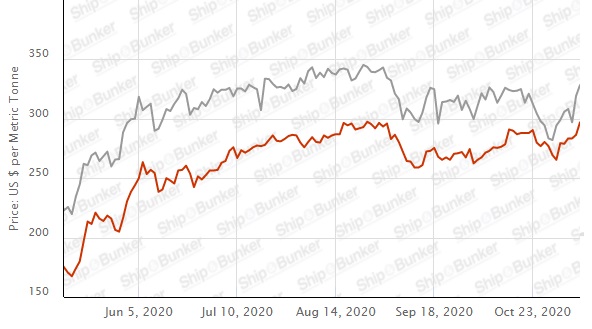
Singapore Bunker Price (IFO380) (red line) versus Brent Oil Price (grey line)
Source: Ship & Bunker
PF Olsen Log Price Index – November 2020
Due to the increase in export log prices the PF Olsen Log Price Index increased by $1 in November to $120. The index is currently $1 below the two-year average, $4 below the three-year average, and $3 below the five-year average. Since September, the index had tracked along the same path as the corresponding period last year but is now $1 below the November 2019 index.
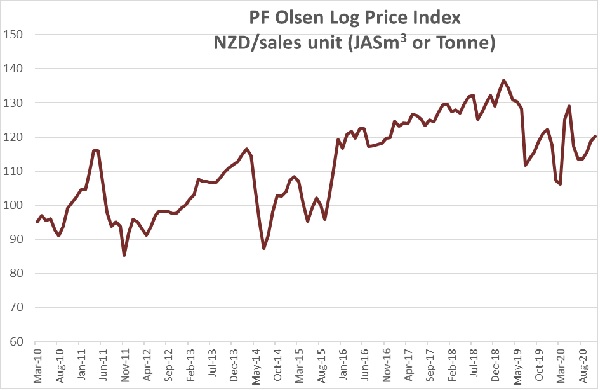
Basis of Index: This Index is based on prices in the table below weighted in proportions that represent a broad average of log grades produced from a typical pruned forest with an approximate mix of 40% domestic and 60% export supply.
Indicative Average Current Log Prices – November 2020
| Log Grade | $/tonne at mill | $/JAS m3 at wharf | ||||||||||
| Nov-20 | Oct-20 | Sep-20 | Aug-20 | Jul-20 | Jun-20 | Nov-20 | Oct-20 | Sep-20 | Aug-20 | Jul-20 | Jun-20 | |
| Pruned (P40) | 170-195 | 170-195 | 170-200 | 170-200 | 170-200 | 170-200 | 170-185 | 165-175 | 155-165 | 162 | 162 | 170 |
| Structural (S30) | 115-130 | 115-130 | 110-120 | 110-120 | 110-120 | 110-120 | ||||||
| Structural (S20) | 105 | 105 | 105 | 105 | 105 | 105 | ||||||
| Export A | 130 | 128 | 123 | 119 | 119 | 125 | ||||||
| Export K | 122 | 120 | 115 | 111 | 110 | 117 | ||||||
| Export KI | 113 | 112 | 106 | 102 | 104 | 111 | ||||||
| Export KIS | 105 | 104 | 97 | 95 | 99 | 105 | ||||||
| Pulp | 46 | 46 | 46 | 46 | 46 | 46 | ||||||
Note: Actual prices will vary according to regional supply/demand balances, varying cost structures and grade variation. These prices should be used as a guide only.
A longer series of these prices is available here.
Log Prices
Select chart tabs
This article is reproduced from PF Olsen's Wood Matters, with permission.

We welcome your comments below. If you are not already registered, please register to comment
Remember we welcome robust, respectful and insightful debate. We don't welcome abusive or defamatory comments and will de-register those repeatedly making such comments. Our current comment policy is here.