
Domestic demand for logs remains steady. Most New Zealand log processors report domestic sales either at or above the same time last year, and they could sell more product if they could produce it.
Export demand for logs has not increased at the same pace as global log supply and log inventory in China has risen by 300-500k m3 over the last month. The CFR price in China has stabilised at 110 USD per JASm3 for A grade logs. Log exporters expect small increases in the CFR price from August onwards. July AWG prices for export logs dropped an average of $6 NZD per JASm3 from June pricing.
Due to the decreases in export log prices, the PF Olsen Log Price Index decreased $3 in July to $114. The index is currently $9 below the two-year average, $11 below the three-year average, and $8 below the five-year average.
Domestic Log Market
Log Supply and Pricing
Log prices have generally remained stable around the country.
Sawn timber markets
Mills continue to report demand stronger than last year and certainly above many forecasts. With New Zealanders unable to travel the DIY market has been booming, even through the winter months. Most mills report they could sell more product if they could produce more. Demand is especially strong for structural timber in the North Island. While demand is strong there has not been any general price increases in structural sawn timber from the merchants.
The kiwifruit industry is thriving in New Zealand as the world chases vitamin C post COVID-19. There has been a lot of new vines planted and they utilise Douglas fir 50mm x 50mm battens in their structures, so this has been a positive niche market.
Export markets for their sawn timber are mixed with Australia demand okay but Asia has received a lot of sawn timber from European countries. Clear sawn timber from pruned logs continues to be in strong demand in Europe and the US. The export returns however are reduced by the NZD strengthening against the USD.
Many mills report labour is still an issue for them. While logs prices have been stable, they have faced price increases in labour, freight, chemicals etc.
Export Log Market
Fumigation with methyl bromide is the main treatment option for above-deck log exports to China, and is the only feasible option for log exports to India. There was a deadline for methyl bromide recapture of 28 October 2020. The New Zealand Environmental Protection Agency has signed a waiver allowing the continued use of methyl bromide for log fumigation until 28 April 2021. The deadline for methyl bromide users to adopt recapture technologies is now 28 April 2021.
China

The summer rains arrived early this year in China and with unusual intensity. Over the past weeks, the average precipitation in the Yangtze River Basin reached a record high since 1961. China has experienced the worst floods in several decades and over 2m people have been displaced with over 20b NZD of damage reported. Surprisingly, the weeks of torrential rain has not significantly slowed down construction activity. Daily port offtake of logs volume is still around 65k.
Logs continue to arrive in China from all around the world. Of the 12 break bulk vessels arriving at Lan Shan port between the 4th and 17th July, 8 are from New Zealand with one each from USA, Australia, Uruguay and Brazil. There is also a break bulk shipment of logs currently being loaded in Germany bound for China. It is difficult to see how this long and relatively expensive shipping route can be sustainably cost effective but may be more a negotiating tool against the rising container and rail costs.
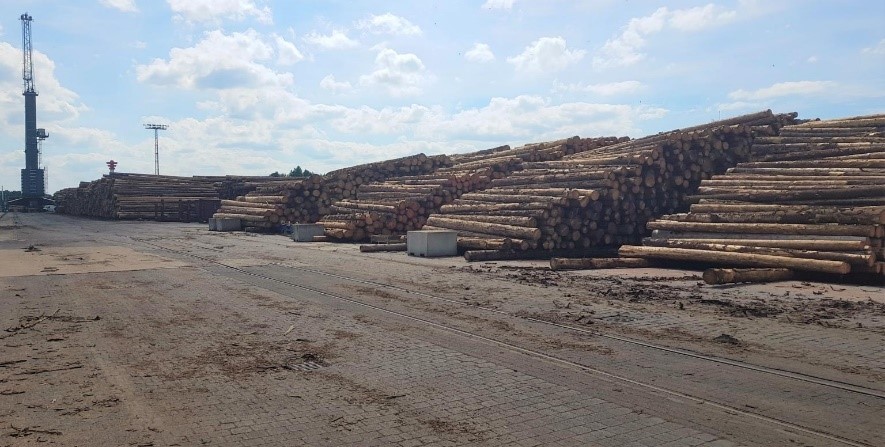
Logs in Germany awaiting shipping.
Log inventory in China has increased about 300-500k over the last month to 4.1-4.3m m3 with very high levels particularly in the Yangtze Delta region. Log exporters are quietly cautious but optimistic about CFR pricing. There are early signs of China export markets recovering. The impact of the current floods is also likely to have an impact.
India
India continues to face COVID-19 issues and demand for sawn timber in Kandla is fluctuating, but due to a log shortage the price for sawn timber has increased to INR 511 per CFT. Two on NZ’s main log exporters are back averaging one shipment per month after a couple of vessels were diverted to China immediately post COVID-19.
Exchange rates
The recent strengthening CNY against the USD will increase the buying power of Chinese log buyers. Unfortunately, the strengthening NZD against the USD will offset any small increases in CFR sale prices in USD.
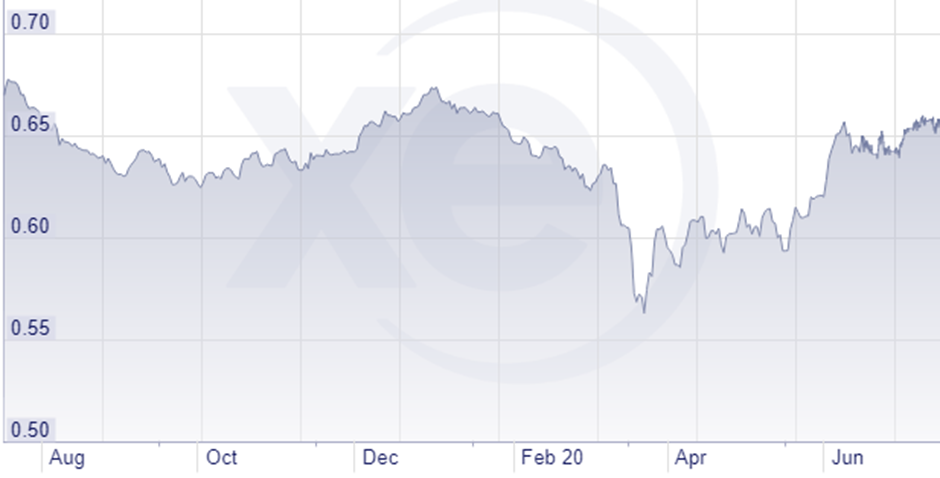
NZD:USD
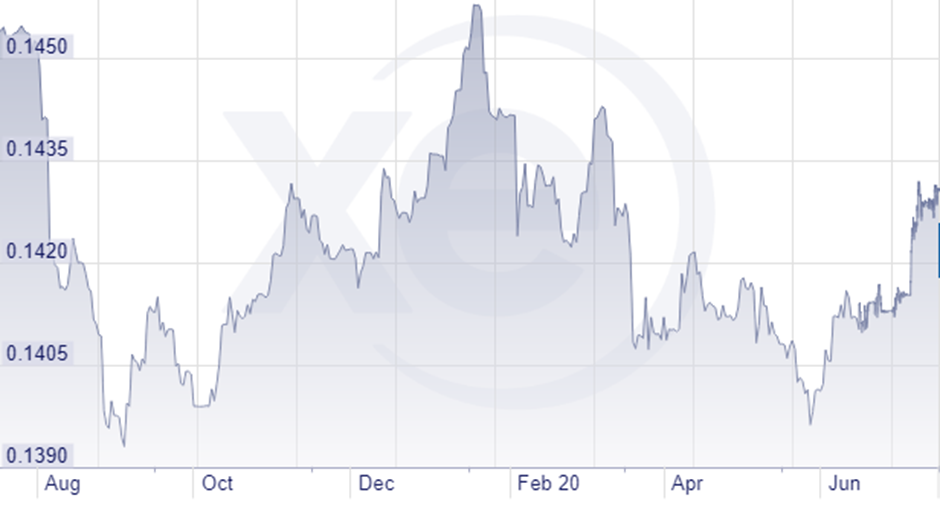
CNY:USD
Ocean Freight
Ocean freight for logs from New Zealand has been stable to slightly up in the last month. Oil prices have increased.
The Baltic Dry Index (BDI) is a composite of three sub-indices, each covering a different carrier size: Capesize (40%), Panamax (30%), and Supramax (30%). It displays an index of the daily USD hire rates across 20 ocean shipping routes. Whilst most of the NZ log trade is shipped in handy size vessels, this segment is strongly influenced by the BDI.
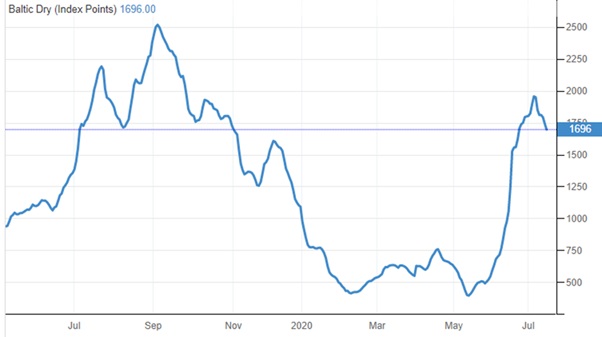
Source: TradingEconomics.com
Singapore Bunker Price
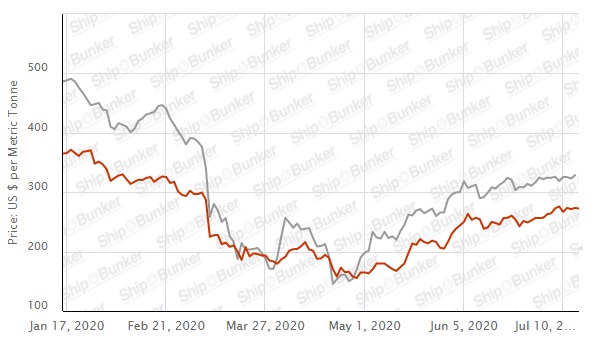
(IFO380) (red line) versus Brent Oil Price (grey line)
Source: Ship & Bunker
PF Olsen Log Price Index – July 2020
Due to the decreases in export log prices, the PF Olsen Log Price Index decreased $3 in July to $114. The index is currently $9 below the two-year average, $11 below the three-year average, and $8 below the five-year average.
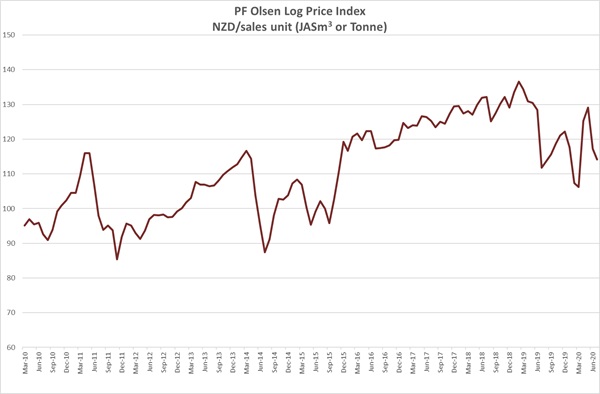
Basis of Index: This Index is based on prices in the table below weighted in proportions that represent a broad average of log grades produced from a typical pruned forest with an approximate mix of 40% domestic and 60% export supply.
Indicative Average Current Log Prices – July 2020
| Log Grade | $/tonne at mill | $/JAS m3 at wharf | ||||||||||
| Jul-20 | Jun-20 | May-20 | Mar-20 | Feb-20 | Dec-19 | Jul-20 | Jun-20 | May-20 | Mar-20 | Feb-20 | Dec-19 | |
| Pruned (P40) | 170-200 | 170-200 | 160-180 | 170-190 | 170-190 | 170-190 | 162 | 170 | 180-190 | 140-145 | 140-145 | 160-175 |
| Structural (S30) | 110-120 | 110-120 | 110-120 | 115-125 | 115-125 | 120-130 | ||||||
| Structural (S20) | 105 | 105 | 105 | 108 | 110 | 110 | ||||||
| Export A | 119 | 125 | 154 | 103 | 103 | 131 | ||||||
| Export K | 110 | 117 | 146 | 95 | 95 | 124 | ||||||
| Export KI | 104 | 111 | 138 | 83 | 83 | 116 | ||||||
| Export KIS | 99 | 105 | 130 | 80 | 80 | 107 | ||||||
| Pulp | 46 | 46 | 46 | 46 | 48 | 51 | ||||||
Note: Actual prices will vary according to regional supply/demand balances, varying cost structures and grade variation. These prices should be used as a guide only. There was no September 2019 report.
A longer series of these prices is available here.
Log Prices
Select chart tabs
This article is reproduced from PF Olsen's Wood Matters, with permission.
5 Comments
I always like the log report. It's one of my economic indicators that I keep an eye on. The fact that we've got a couple of hectares of trees due in 2023 helps.
How much per hectare do you think you’ll get after harvesting costs?
I've always worked on 35k minimum, if not my trees stay where they are
It will mostly come down to timing.
Great to have some practical real insight into a market. Wish other sectors could do more of this.

We welcome your comments below. If you are not already registered, please register to comment
Remember we welcome robust, respectful and insightful debate. We don't welcome abusive or defamatory comments and will de-register those repeatedly making such comments. Our current comment policy is here.