
The CFR sale price for A grade logs in China remained in the mid US$120s range per JAS m3. At Wharf Gate (AWG) prices for export logs delivered to ports around New Zealand in December increased by an average of 2-3 NZD per JASm3 from November pricing. Most exporters had predicted December pricing similar to November, however there was a reduction in shipping costs as overall demand for ocean freight remains low. Log stocks in China have risen to approximately 4.4M m3.
Domestic demand for logs remains stable and relatively balanced throughout New Zealand as the year end approaches, although there was a hiccup in demand for pruned logs in the Central North Island when the Claymark group went into sudden receivership in the first week of December.
Due to the increase in the AWG prices the PF Olsen Log Price Index for December increased $1 to $122. The index is currently $5 below the two-year average, $4 below the three-year average, and $2 higher than the five-year average.
Domestic Log Market
Log Supply and Pricing
There have not been any significant log price changes as mills work towards the end of the year with the aim of not holding large log inventories over the Christmas holidays. There was the usual swing of log volume from domestic supply to export as mills shut for the year.
The Claymark group went into sudden receivership in the first week of December and log supply was stopped to their processing sites at Rotorua, Katikati and Thames. The receivers moved swiftly to restart log supply.
Sawn timber markets
The supply of structural and industrial grade sawntimber is high as mills aim to reduce their exposure to Asian markets that have been oversupplied by the spruce and other sawntimber produced from the damaged European forests. Maybe the opportunity will be in a few years’ time when Europe is short of local sawntimber. If demand does not increase in 2020 there will likely be pressure on prices in these market segments.
The domestic demand for clear timber is relatively stable and supply is managed as the price for the high quality clear sawntimber in Europe remains very high.
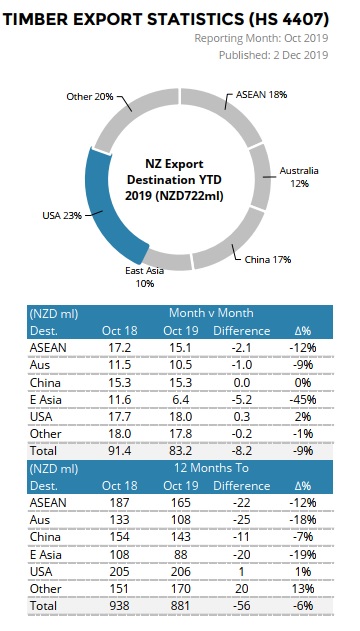
Several sawmills that supply the Australian market are hopeful the market is now at the bottom of its cycle and there will be improvements in 2020. Year to date supply by value in 2019 is down about 18% compared to 2018.
The following chart shows export sawntimber supply by value for each destination.
Source: Champion Freight.
Export Log Market
Year to date in 2019 New Zealand has supplied 80% by value of its export logs to China. The following chart shows export log supply by value for each destination.
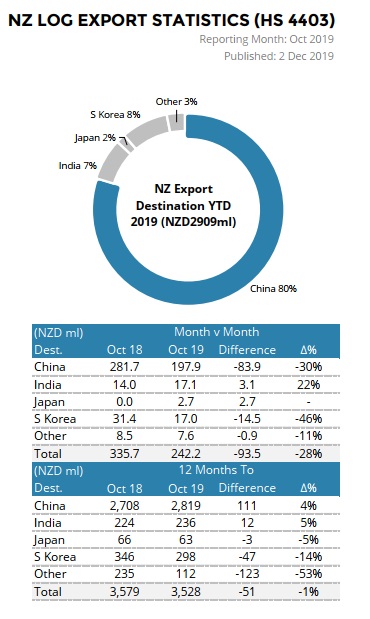
Source: Champion Freight.
China
The price for an A grade log in the China log market has remained around USD 124 per JASm3. The demand for logs has already started to reduce in advance of the China Lunar New Year next month. The softwood log inventory has risen to approximately 4.4M m3. The spruce logs from the timber salvage programs in Europe continue to impact the China log market with most of the current spruce logs coming from Germany and a smaller amount from the Czech Republic, and other neighbouring countries. There are also reports of highly stressed trees in forests in nearby countries that will likely succumb to bark beetle. The FEA estimated the central European volume of damaged logs at over 100M m3. Earlier this the supply of this spruce to China was limited by the supply chain but the combination of German efficiency and the ability of Chinese log traders to spot an opportunity always meant this volume was likely to increase. Log supply has been over 1M m3 per month since September. Log prices have also dropped 15% since Q2.
While the supply of spruce sawn timber has reached its peak as there is no additional sawmilling capacity, the supply of spruce logs is only limited by the supply chain and the willingness of Chinese log processors to substitute with spruce logs.
China’s Gross Domestic Product (GDP) rose just 6.0% year-on-year in Q3 2019. This is China’s weakest economic growth in almost three decades (since the first quarter of 1992). It was also at the bottom end of the government’s full-year target range of 6.0%-6.5%.
Numbers from the construction sector remain relatively stable. Total investment in real estate had an accumulated increase of 10.5% in September year-on year. The total floor area completed in Q3 was 866M m2, which was a 14.4% increase fromQ2 but 17M m2 below Q3 2018.
The average new home price across the 70 major cities in China rose 0.5% from August to September. The China government has expressed wariness around high debt in the sector along with the risk of a bubble burst so are refraining from stimulating this economy.
India
Sales of New Zealand logs in India remain difficult. The CFR for A grade is in the USD 136-138 per JASm3. A Singapore based trader working with his Uruguay supplier has announced another vessel (December loader) to Kandla of about 34,000 m3 with A grade longs quoted at CFR USD 128 per JAS m3.
The anticipated increase in the sale price for radiata sawntimber produced by the Indian mills was instead largely substituted by cheaper imports of the aforementioned softwood sawn timber from Europe. Construction activity in the Delhi NCR region had taken a hit when the government imposed a temporary ban on construction activity to control elevated levels of air pollution. Approximately 50-60% of the green lumber from mills located in Gandhidham is sent to Delhi NCR. The ban was lifted in mid-December and sales are now in the range INR 411-421 per CFT, after falling from INR 431 per CFT in November.
Production of sawn timber from New Zealand logs is unviable at current relative prices for sawn timber and logs. The market is making a concerted effort to bring sawntimber prices close to INR 440 before the end of the year.
The packaging industry continues to demand sawn timber from New Zealand logs, as that market is stable and requires a minimum output each month.
The South India log market remains dull and is serviced mainly by container softwood import trades as opposed to break bulk vessels. The last vessel from New Zealand to Tuticorin was loaded in July 2019. The South Indian sawmills have been very diligent in not letting prices of radiata sawn timber fall below INR 471 per CFT. This however has kept the activity level quite low.
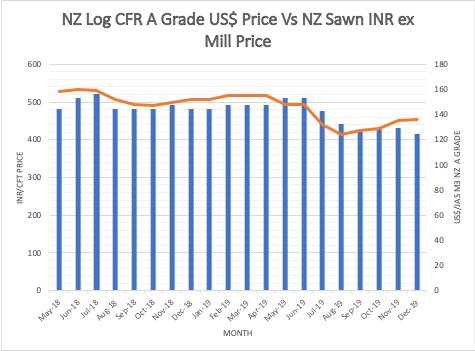
Source: Aubade Global Resources Ltd
Exchange rates
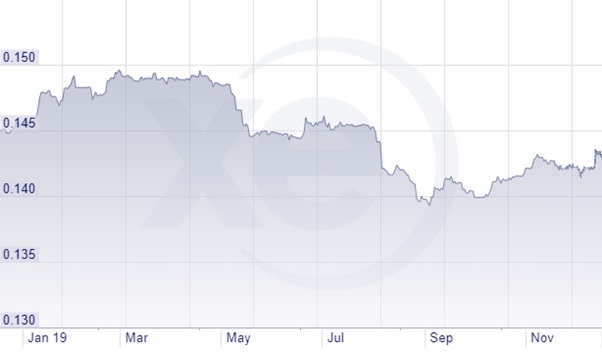
The NZD was relatively stable against the USD through November so had little impact on December AWG prices. THE NZD has strengthened against the USD through December.
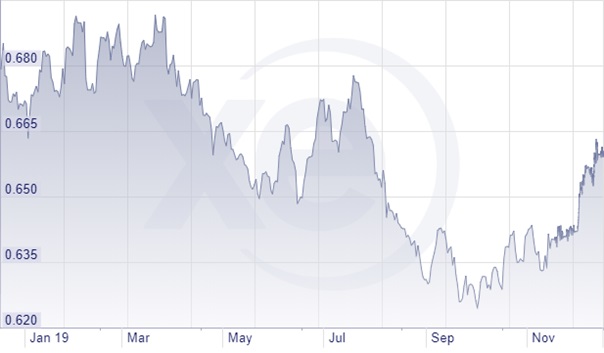
NZD:USD
CNY:USD
Ocean Freight
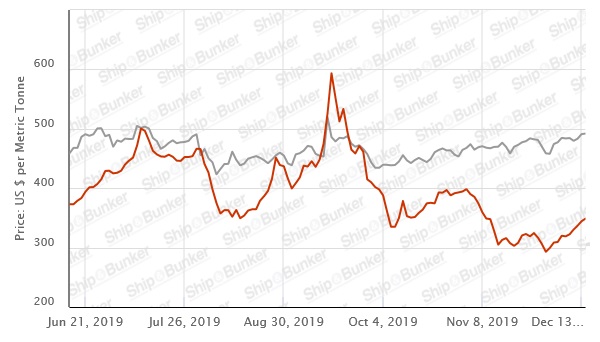
Shipping rates have remained stable depending upon timing of charter. Some better deals were achieved by exporters who took a risk and delayed chartering vessels. Demand for ocean freight has reduced around the world as suppliers of all commodities prepare for the Chinese New Year in January. Singapore Bunker Price (IFO380) (red line) versus Brent Oil Price (grey line)
Source: Ship & Bunker
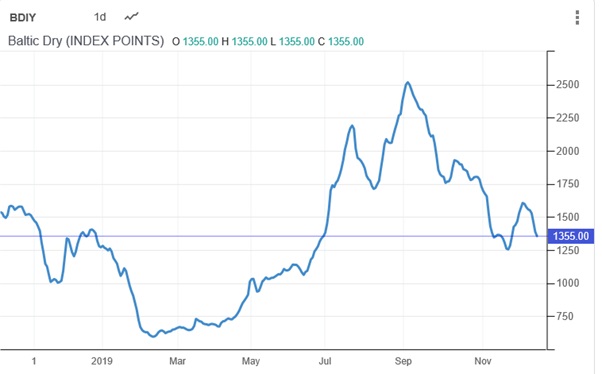
The Baltic Dry Index (BDI) is a composite of three sub-indices, each covering a different carrier size: Capesize (40%), Panamax (30%), and Supramax (30%). It displays an index of the daily USD hire rates across 20 ocean shipping routes. Whilst most of the NZ log trade is shipped in handy size vessels, this segment is strongly influenced by the BDI.
Source: TradingEconomics.com
PF Olsen Log Price Index - December 2019
Due to the increase in the AWG prices the PF Olsen Log Price Index for December increased $1 to $122. The index is currently $5 below the two-year average, $4 below the three-year average, and $2 higher than the five-year average.
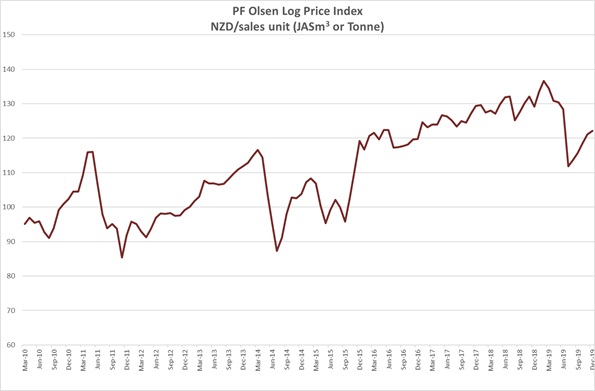
Basis of Index: This Index is based on prices in the table below weighted in proportions that represent a broad average of log grades produced from a typical pruned forest with an approximate mix of 40% domestic and 60% export supply.
Indicative Average Current Log Prices – December 2019
| Log Grade | $/tonne at mill | $/JAS m3 at wharf | ||||||||||
| Dec-19 | Nov-19 | Oct-19 | Aug-19 | Jul-19 | Jun-19 | Dec-19 | Nov-19 | Oct-19 | Aug-19 | Jul-19 | Jun-19 | |
| Pruned (P40) | 170-190 | 170-190 | 170-190 | 170-190 | 170-190 | 175-190 | 160-175 | 160-175 | 160-175 | 140-155 | 178-183 | 178-183 |
| Structural (S30) | 120-130 | 120-130 | 120-130 | 125 | 125 | 132 | ||||||
| Structural (S20) | 110 | 110 | 110 | 110 | 110 | 115 | ||||||
| Export A | 131 | 129 | 124 | 107 | 103 | 140 | ||||||
| Export K | 124 | 121 | 116 | 101 | 96 | 132 | ||||||
| Export KI | 116 | 114 | 108 | 92 | 87 | 123 | ||||||
| Export KIS | 107 | 105 | 105 | 85 | 81 | 116 | ||||||
| Pulp | 51 | 51 | 51 | 51 | 51 | 51 | ||||||
Note: Actual prices will vary according to regional supply/demand balances, varying cost structures and grade variation. These prices should be used as a guide only. There was no September 2019 report.
A longer series of these prices is available here.
Log Prices
Select chart tabs
This article is reproduced from PF Olsen's Wood Matters, with permission.

We welcome your comments below. If you are not already registered, please register to comment
Remember we welcome robust, respectful and insightful debate. We don't welcome abusive or defamatory comments and will de-register those repeatedly making such comments. Our current comment policy is here.