

They say that a picture paints a thousand words.
Well, to kind of turn that around - a load of figures can paint quite a picture.
And a very interesting picture emerges when you immerse yourself in the new, vastly expanded, debt to income ratio figures debuted by the Reserve Bank this month.
The RBNZ has been running a DTI series for a few years now, but till now these haven't been showing breakdowns of investor DTIs, or owner-occupier mortgages with investment property collateral. And, also, now the new series features more DTI brackets - meaning we can now get a handle on who's been getting mortgages at an eye-watering NINE times annual income.
This more detailed breakdown of the DTI facts and figures comes as the RBNZ readies itself for consultation this month on a proposal to introduce DTI measures into the central bank's 'macro-prudential toolkit' alongside existing measures such as the loan-to-value ratio (LVR) limits.
I already had a quick look on Monday at some of the facts and figures, particularly pertaining to first home buyers and owner-occupiers. Here again, quickly, is the table run with that article, which demonstrates the still rising percentages, particularly of FHBs with mortgages on DTIs of five and above.
The table below shows the percentage of new mortgage money with debt-to-income ratios of over five times:
| Group | Sep 21 | Jun 21 | Sep 20 |
|---|---|---|---|
| FHBs nationwide | 58.3% | 57.5% | 43.3% |
| Auck FHBs | 76.4% | 71.3% | 57.5% |
| Non-Auck FHBs | 47.8% | 45.7% | 32.3% |
| Other owner/occ nationwide | 46.3% | 44.9% | 37.7% |
| Auck other owner/occ | 61.5% | 57.7% | 49.0% |
| Non-Auck other owner/occ | 35.7% | 34.2% | 30.3% |
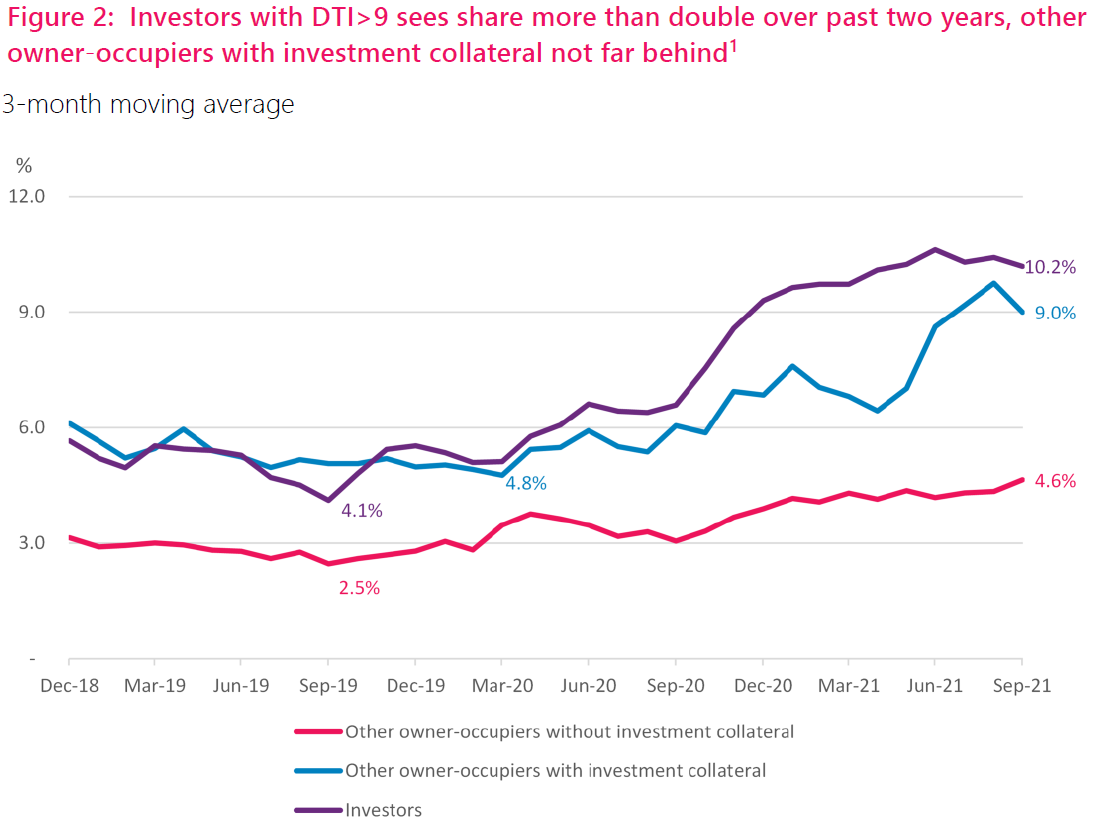
'Impressive' as these figures are, they've actually been outdone at times with the ratios the investors, and also owner-occupiers with investment property collateral, have been achieving.
I should say at this point that the next four graphs sprinkled through this article are courtesy of the RBNZ and refer to the September DTI figures.
And, much as could always have been expected, the figures demonstrate that the investors were quick to take advantage of the Covid-induced super-low interest rates of last year and also the removal of LVR limits - which have of course subsequently been put back on.

I'll try not to bog you down with loads of figures, but here come some examples.
On a nationwide basis, in September 2019, investors borrowed just over $1 billion, of which 55% was on DTIs of five and above. A little under $50 million (4.6% of the investors' total) was borrowed on a DTI of nine or above.
Fast forward to September 2020 when the post-lockdown, 'yippee, no LVRs!', feeding frenzy was getting underway in earnest and investors borrowed a bit over $1.5 billion, with slightly over $1 billion of this - 67.6% on DTIs of five and more. Over $100 million, 7.1% was borrowed on a DTI of 9+.
By December 2020 when the house market was an inferno and LVRs were on the way back, some 71.4% of investor mortgages (over $1.6 billion) were on DTIs of five and more. Over $200 million (9.3%) was borrowed on a DTI of 9+.
Even though the LVRs are back and interest rates are now moving up (more on the latter point shortly) the investors have continued to borrow at reasonably expansive DTIs.

In September 2021 they borrowed nearly $800 million (68.2% of the investors' total) at DTIs of 5+. Over $100 million (9.7%) was borrowed on a DTI of 9+.
As you might imagine, given Auckland's exhilarating price levels, the DTIs of Auckland investors have been even racier.
In terms of DTIs of five and over, the $960 million borrowed in December 2020 by the Auckland investors at those DTI levels made up just shy of 80% of the total. As of September 2021 this ratio was 'down' to 77.4%.
However, lest you think that was all looking a bit stratospheric, Auckland owner-occupiers with investment property collateral have been doing even a bit 'better' than that. Since September 2020 this grouping has regularly seen in excess of 80% of its mortgage money advanced on DTIs of five and over.
In September 2021 this grouping borrowed over $400 million (80.5% of the group's total) at DTIs of five and up.
Nearly $40 million (7.3%) was on a DTI of 9+. But the latter figure was actually a sharp reduction.
In June of 2021 just over $100 million (15.1% of the total for this group) was borrowed on DTIs of 9+.

How are folk affording all this? Well, clearly they are. And the super-low interest rates have clearly been a big factor in that.
But it's worth putting some of this data up against the backdrop we've now got of fast-rising mortgage rates.
A couple of examples follow.
To go back to our old favourites the FHBs, in September 2021 some $61 million of Auckland FHB mortgage money was advanced on a DTI of 7+. In terms of individual mortgages, there were 64 of them, so roughly $950,000 per mortgage (if we take the average). If we also assume a DTI of seven, this would imply our mortgage holder has household annual income of around $136,000 - again, it's an average.
As of September, according to the RBNZ the average two-year fixed mortgage 'special' rate was 3.15%. Assuming a 30 year mortgage for $950,000, at 3.15% this would, so the trusty interest.co.nz calculator says, require monthly payments of $4083, or a bit over 36% of the monthly income.
To take on the same mortgage now, less than two months later, our FHB could be paying 4.15% (and they could be paying more). This would work out to monthly payments of $4618, which is getting on for 41% of the monthly income. In dollar terms its now $535 more a month. Which would be noticed.
Well, we always go on about the FHB! What about an 'other' owner-occupier.
To take another Auckland example, as of September 2021 the RBNZ figures tell us that some $90 million of mortgages were taken out by 84 owner-occupier applicants on DTIs of 9+.
That's an average-sized mortgage of $1.07 million. Applying a DTI of nine would give us an average household income for these applicants of $119,000.
Running the same set of calculations would see the mortgage as of September requiring payments of $4598 a month - about 46.4% of income.
To get the same deal today, based on 4.15% mortgage rates, would require monthly payments of $603 more, making $5201 a month, or 52.5% of income.
Life is going to get pretty interesting for some mortgage holders if the current levels of mortgage rates stay with us - or increase - over the next couple of years.
We welcome your comments below. If you are not already registered, please register to comment
Remember we welcome robust, respectful and insightful debate. We don't welcome abusive or defamatory comments and will de-register those repeatedly making such comments. Our current comment policy is here.