

The purpose of this article is to point out an oddity in financial markets.
Many readers will notice swap rates have been falling recently, especially swap rates at the short end of the rate curve.
The falls for the one year looks dramatic where the scale is recent.
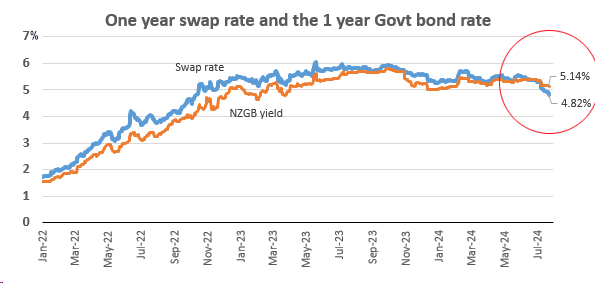
But over the longer term, as the chart below shows, it isn't too special. True it is falling, and that gives strong market signals.
Swap rates are a key tool for banks and other financial institutions for their interest rate management. They need to hedge interest rate risk and the swap rate reflects the supply/balance of these forces.
NZ government bond (NZGB) yields in secondary markets reflect what investors will take as a return for the term to maturity of that bond. In addition to normal investor demand and expectations, this market is influenced by bond supply. In times of strong issuance, and much alternative availability, investors can come and go as they please as they know there will be plenty available. Only higher yields from the alternatives keeps demand for a particular maturity.
So the swap and government bond markets are generally influenced by the same forces, but specifically influenced for quite different factors in their separate corners of financial markets.
Generally you would expect the more 'risky' swap markets to be priced higher than the pristine-rated government bond markets.
But this is where recent conditions have turned unusual.
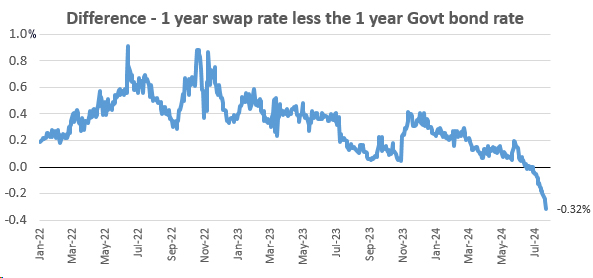
Now, swaps are 'cheaper' than NZGB yields. It is a very recent twist.
The difference shows how fast this twist has happened.
In swaps market, the desire to lock in fixed rates is lighter now due to weak loan demand. That means the upward pressure is low, so the pay side pressures dominate, which put downward pressure on these negotiations and deals.
In contrast, rising government bond issuance to finance larger deficits is keeping yields in this market elevated.
They are separate corners of the financial markets, so it is quite conceivable they move in different ways, even if it's unusual.
The risk element is being overwhelmed by the sudden drop in pressures to hedge loan demand, because loan demand is weak.
We have focused on the one year here, because readers are likely to be following swap rates as an indicator of where mortgage rates might track.
But in fact, the anomaly is more pronounced for the longer maturities.
Theoretically, these anomalies should not exist, as swap rates represent a weaker credit quality than a NZGB, and thus should be arbitraged. But they do exist and may persist for a short time. The smallness of our financial markets probably contributes to less arbitrage capacity and activity.
Regulation plays a part too. Many countries require government bond market makers to hold more capital, reducing appetite to hold large government bond portfolios. US swap spreads also have similar anomalies.
Locally, our yield curve is expected to steepen due to the looming Reserve Bank easing cycle, so shorter NZGB maturities will outperform longer ones.
But the big influence here is that our economy is slowing, and this results in less demand for funding, which in turn exerts less upward pressure on swaps.
*H/T to JW and IS for background briefings for this review.
8 Comments
David, when did this twist last happen?
From that graph, the cross-over looks like Friday 19th July 2024 to me!
🤣😆 Funny, left myself wide open on that one. Was there a time before that! Possibly a link to historical beyond 2022?
Our records only go back to June 2007. It has happened briefly in 2009, 2010, and 2013. And between June to October 2020 (pandemic). But now is the deepest difference since when our records began
Very insightful, informative, and well articulated for someone like myself who sometimes struggles with understanding this relationship.
This def doesn't happen very often and I would speculate it's a result of borrowers staying variable in expectation of lower rates and fast money piling in looking for rate cuts.
FWIW, That means the upward pressure is low, so the pay side pressures dominate, which put downward pressure on these negotiations and deals.
Should read receive side dominates, pay fixed = borrow.
Regulation plays a part too. Many countries require government bond market makers to hold more capital, reducing appetite to hold large government bond portfolios. US swap spreads also have similar anomalies.
US Large Commercial Banks Treasury & Agency Securities Assets
Scroll down in this link to view US Treasury and SOFR derived US Interest Rate Swap levels.
The Global Monetary System Is Reliant on Swap Spreads (Here's what they are)
Suffice to say, these anomalies, which affect more markets than just swaps, occur when there is a substantial wind change.
We welcome your comments below. If you are not already registered, please register to comment
Remember we welcome robust, respectful and insightful debate. We don't welcome abusive or defamatory comments and will de-register those repeatedly making such comments. Our current comment policy is here.