By John Hart, partnership lead at the Wairarapa Catchment Collective.
Why do we love maps so much? As far as human technologies go, it’s one of the older ones. The oldest world map that we know of is a 2900 year old Babylonian tablet, and no doubt there were many others before that.
Humans are pattern matching machines, always looking to understand the wider context and where we fit in. As a way of understanding a world that is bigger than just our current viewpoint, you can’t beat a map.
In my day job as partnership lead for the Wairarapa Catchment Collective I’m part of a team supporting farmer-led catchment groups across Wairarapa. Our mission is to help catchment groups achieve more by connecting them with the resources they need to thrive.
Part of that is connecting them to each other, to learn and share ideas, but also showing how they are all part of a bigger picture. Whether it’s farm-scale for planning, or looking out to the wider catchment, the common language is usually maps - visualisations of where we are, and in some cases, where we want to be.
When it comes to data sources, we are awash with possibilities. Government agencies like LINZ and MfE have a huge array of data layers you can plug into a geographical information system (GIS) to analyse or remix into maps for your specific purpose.
The challenge with having so much data available has always been how best to visualise it in order to make useful decisions. In the catchment space those questions are often around things like analysing hill slopes to determine erosion risk or planning where to put trees and fences for maximum results.
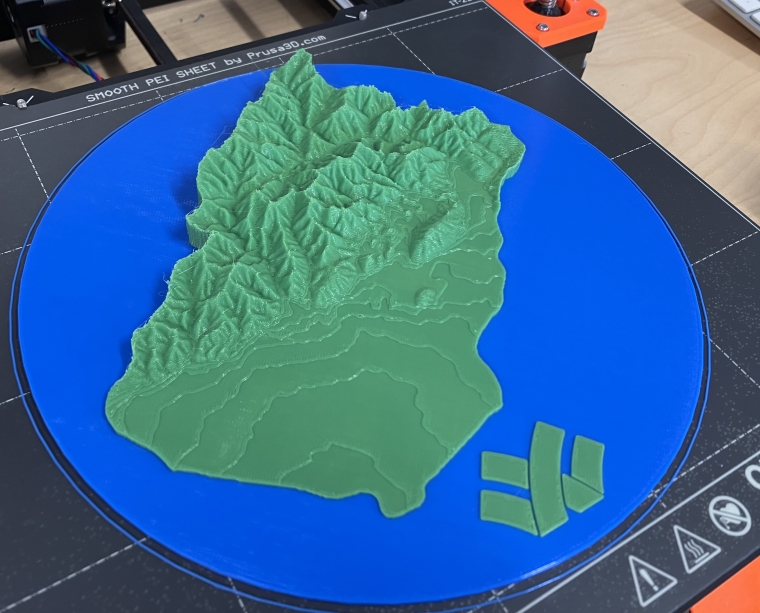
Adding some new(ish) technology to the mix could make our map data even more engaging and meaningful. 3D printing technology has been around for more than a decade, but more recently it has started to allow the creation of three dimensional interpretations of map data.
The process of converting map data into a file suitable for 3D printing is a little bit technical, but one of the easiest ways to do it is with the R programming language - it’s designed for statistical computing, but it also happens to be really good at transforming map data.
There is something magical about watching a 3D print emerge from nothing as the printer builds it layer by layer out of molten plastic. Even more so when it’s a piece of landscape you know and live in.
Being able to hold a three dimensional piece of the map in your hand is a neat experience and it allows us to think about and interact with map data in a different way. The newer multi-colour 3D printers even allow you to pick out details like waterways in another colour. In theory, any data layer you can find from walking tracks and huts, to trap locations could be added to a 3D printed map.
As a tool for visualising landscape data it’s pretty compelling. Almost everyone I’ve seen interacting with a 3D printed map will marvel at the little details, tracing the contours of their valley, or pointing out where their place is.
Usually the first question is: “can I get one of my farm?” Fortunately with the high-resolution map data we have for most of the country the answer is yes. At least that’s my Christmas list sorted for the farmers in the family!
8 Comments
What a great idea!! Where can I get one?
Try your regional council.
Can also get historical aerial photos, that can be interesting.
The aerial photos can also prove handy in "discussion" with Council.
Council: "You're over your hardstand limit, you'll have to apply for resource consent for it."
Landowner: "But we haven't added any. When did the bylaw come in?"
Council: "2005, then updated in 2015."
Landowner: "Oh, well here's the council's own aerial photos from 2004 that show..."
Yes, and I think councils have to provide access to them. That is why retrolens was setup, to make it easier.
You used to be able to get aerial photos taken from different angles that you could view so they looked 3D. Whatever happened to this?
And LiDAR data from LINZ. Once you've trimmed the boundary you need and played with some of the variables like z scale and overall dimensions rayshader can generate a 3d file. I sent one to our local library to get a 3d print done of the ranges where I'm volunteering on a predator trap line. For a the price of 3 coffees I now have a 3d print sitting on my desk. Open source software FTW.
Apart from farms, there are great 3d maps of some geological features online, I think it's landsar, or geoset? Putting them out.
https://www.linz.govt.nz/news/2024-09/new-zealands-basemaps-elevated-3d
Dont know if this is it ?
We welcome your comments below. If you are not already registered, please register to comment
Remember we welcome robust, respectful and insightful debate. We don't welcome abusive or defamatory comments and will de-register those repeatedly making such comments. Our current comment policy is here.