
According to the Crown Accounts for the period to October 2021, which were released by Treasury on December 1, 2021, income taxes on individuals accounted for 48% of all Total Tax Collected (excluding levies and fees). Corporate tax added another 17% and GST some 25%. (These proportions are for the twelve months to October.)
It peaked in the year to March 2021 at just over 49%, but the latest levels are at the high end of the data over the past decade.
Company taxes deliver tax depending on profitability and that has been stunted since the onset of the pandemic.
It is the reliance on taxes on individuals that makes up the core of Crown 'revenues'. Together with GST, that now accounts for almost three quarters of all income taxes.
Government spending essentially depends on taxing the citizenry.
While that is hardly 'news', what might impress readers is how fast those taxes are growing, especially income taxes.
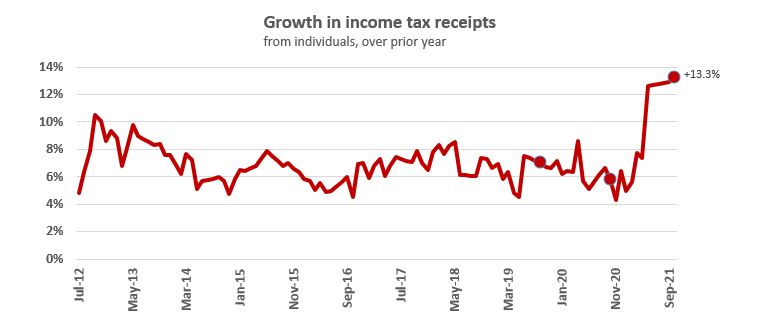
Income taxes have 'never' grown so quickly (our downloading of the record goes back to 2003).
Here is a summary of the recent data:
| 2017/18 | -> | 2018/19 | -> | 2019/20 | -> | 2020/21 | |
| $ bln | % | $ bln | % | $ bln | % | $ bln | |
| Nov | 3.192 | 9.8% | 3.505 | 8.9% | 3.816 | -7.6% | 3.527 |
| Dec | 3.081 | -2.5% | 3.004 | 3.9% | 3.121 | 31.2% | 4.095 |
| Jan | 3.527 | 11.5% | 3.932 | 2.2% | 4.017 | -12.1% | 3.529 |
| Feb | 2.865 | 3.0% | 2.952 | 5.1% | 3.104 | 13.8% | 3.533 |
| Mar | 2.999 | 7.5% | 3.223 | 7.0% | 3.449 | 31.5% | 4.534 |
| Apr | 3.272 | -9.8% | 2.951 | 17.5% | 3.466 | 12.0% | 3.882 |
| May | 3.332 | 7.8% | 3.593 | -22.8% | 2.773 | 44.3% | 4.002 |
| Jun | 2.477 | 30.0% | 3.219 | 16.9% | 3.764 | 16.5% | 4.384 |
| Jul | 3.109 | 4.2% | 3.240 | 10.5% | 3.582 | 11.6% | 3.999 |
| Aug | 3.109 | 4.2% | 3.240 | 10.5% | 3.582 | 11.6% | 3.999 |
| Sep | 3.109 | 4.2% | 3.240 | 10.5% | 3.582 | 11.6% | 3.999 |
| Oct | 2.992 | 15.1% | 3.443 | 4.5% | 3.598 | 8.9% | 3.917 |
| ---------- | -------- | ---------- | -------- | ---------- | -------- | ---------- | |
| 12 months | $37.064 | 6.7% | $39.543 | 5.8% | $41.853 | 13.3% | $47.399 |
Two effects are driving this - more people employed in the workforce, and bracket creep. With borders closed and higher pay levels as a result, the effect of bracket creep is turbocharged.
The detail of this data isn't the point; the point is the unprecedented recent growth. But the detail does show the growth isn't due to weak base effects. This growth is on top of tax growth on individuals that has been much faster than the expansion of economic activity.
What is underway is a steady, relentless and accelerating redistribution of income from taxpayers to the Government. In turn, they redistribute 'some' of that back to those they deem needy, although State Services Commission data shows a growing portion is going on expanding the public sector where pay increases have been rising faster than the private sector for a long time.
Whatever the reason, the proportion of the New Zealand economy needed to support central government activity is growing. In the year to September 2021, nominal GDP was $343.5 bln and income taxes transferred $99.4 bln to central government, or 28.9%. In the year to September 2011 nominal GDP was $208.4 bln with $51.6 bln in income taxes transferred, or 24.8%. The extra transferred away from individual taxpayers in 2021 over the 2011 levels amounted to $14.2 bln.
We welcome your comments below. If you are not already registered, please register to comment
Remember we welcome robust, respectful and insightful debate. We don't welcome abusive or defamatory comments and will de-register those repeatedly making such comments. Our current comment policy is here.