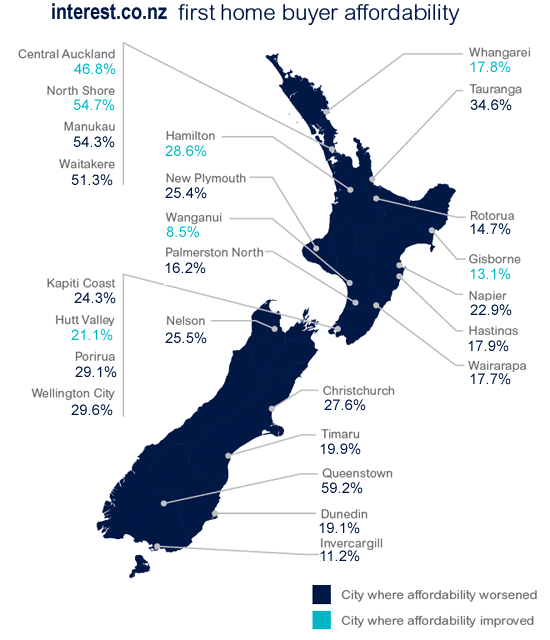
The interest.co.nz home loan affordability index for first-home buyers - April 2016:
Household income is a key criteria for lending institutions. We have established a set of standardised household profiles, and these can be used to check affordability.
It now takes 22.8% of the median after-tax income of a couple in the 25-29 age group to pay the mortgage on the lower-quartile priced house in April . This is down from 23.0% in the previous month, March. A year ago, it was 24.6%.
Essentially the median income for a couple is enough to buy a lower-quartile priced house.
But saving the necessary initial deposit will be a significant barrier for many.


Deposit
The first-home buyer index is calculated assuming that the house buyers have been saving for four years, and that amount saved in the four years is then used as a deposit. Based on current income and house prices it will take the household 1.8 years to save a 10% deposit, and 3.6 years to save a 20% deposit as now required by most banks.
Key drivers of home loan affordability:
House prices
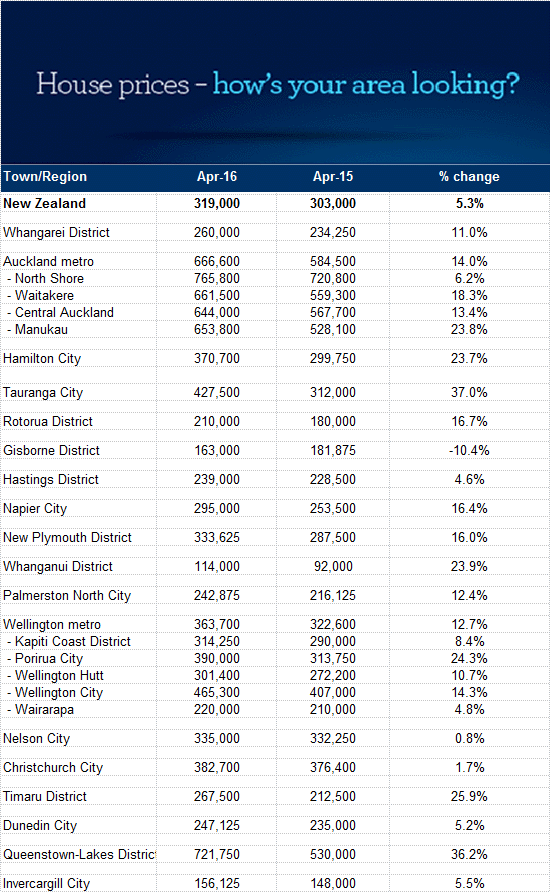
The lower-quartile house price was $319,000 in April, down from $320,000 last month. Annual growth was 5.3%, from the $303,000 lower-quartile house price in April 2015.

Interest rates and mortgage payments
The average bank interest rate for two year fixed mortgage rate was 4.45% for April, -112 basis points less than the 5.58% twelve months earlier.
During March, markets started to anticipate a rate cut by the RBNZ, (one that was actually delivered in March). Wholesale rates started feeling in that anticipation, helped by some turmoil in international markets. Further rate cuts remain a possibility even though rate levels are at historical lows.
Wholesale interest rates often move differently to the OCR and borrowers should check their options to switch to a fixed rate.
Our model assumes borrowers switched to a 2 year fixed rate in June 2014, following the shift reflected in RBNZ data. (See note below). Despite the OCR rise, two tear fixed rates actually fell in August as banks launched rate ‘special’.

Single income affordability:
It now takes 46.3% of one median income of a person in the 25-29 age group to pay the mortgage on the lower-quartile priced house in April, down from March’s 46.7%.
This index was 50.2% a year ago and 46.0% four years ago. This affordability index reached its highest point of 74.6% in June 2007.
For comparison, it takes 42.4% of one median income for the 30-34 year old age group to pay the mortgage on the lower-quartile house price, up from March’s 39.8%..
This index was 46.8% a year ago and 41.9% four years ago.
Essentially a single median income for a first-home buyer is not high enough to buy a lower-quartile priced house, even with a deposit around 10% of the house’s value. However, a couple/family with more than one income may find the lower-quartile house price is affordable.
After-tax income
The median weekly take-home pay for a first-home buyer (individual) was $780.36 in April, up from the $778.22 last month and up from $761.96 in April 2015.
Five years ago, median weekly take-home pay was $695.64.
Disposable Income (wages minus mortgage payment)
Weekly disposable income was $418.92 in April, $39.56 higher than the $379.35 in April 2015 (and compares with $414.62 one month earlier). This measure shows why current property prices exclude so many potential buyers.

The profile we use for a first-home buyer household is one adult male working full-time, one adult female working full time, with no children.
No chart with that title exists.
Refer to our Median Multiple reports for a reconciliation of this report to the internationally comparable benchmarks, by city.
Details of our household profiles, the data sources, and the methods used, are set out in the Notes section of this report, below.
Full regional reports are available below:

Note to Editors:
This work must be referred to as The interest.co.nz Home Loan Affordability series. There are two related components – the Standard home loan affordability series, and the First-home-buyer home loan affordability series. They have both been produced by www.interest.co.nz. Please direct queries via email to info@interest.co.nz, or see our contact information below.
Sources / Definitions / Methodology
*a first-home buyer: An individual in the 25-29 year old age group that buys the lower-quartile priced house with a deposit as calculated below.
Interpreting this Index:
These affordability indexes measure the proportion a weekly mortgage payment is of weekly take-home pay. A separate measure is generated for each region, plus a national one, and for other various mortgage interest rate terms.
Weekly Income (source change):
From the July 2007 Report onward, the source on which we base our estimates of weekly income, is now the LEEDS (Linked employer-employee data survey) data from Statistics New Zealand.
The first-home-buyer home loan affordability report is based on the LEEDS data for the 25-29 age group.
Income tax rates from IRD are used to calculate a take-home pay (which is the LEEDS-based data net of the specific income tax rate).
Deposit - First home buyer index:
As house prices vary by region to a larger extent than wages, we refrained from using a simple 10% deposit-90% mortgage rule to emulate a first home buyer. Instead, to capture the disparity between incomes and house prices we estimate the deposit as a function of savings – that is 20% of weekly income saved for 4 years, plus interest earned at a 90 day deposit interest rate.
Home Loan: (Lower quartile house price less the deposit)
Mortgage repayments are based on the value of the home loan, paid weekly for 25 years, using the 2 year bank average interest rate. The home loan is assumed to be a standard table mortgage, where both interest and principal is repaid in a fixed weekly payment made in arrears. The repayment is calculated using the tools at https://www.interest.co.nz/calculators/mortgage-calculator.
Mortgage Rates:
Average mortgage interest rates are sourced from www.interest.co.nz. These averages are for banks only as banks have 90%+ of the mortgage market. Affordability calculations are done for mortgages at the floating rate and one year through to the five fixed-rate terms. In this report, the two-year fixed mortgage interest rate is used. Until August 2010 this series used a 2 year fixed rate loan as the basis for interest rates. In September 2010 it was switched to the floating rate, reflecting actual market shifts by borrowers. In June 2014, it was switched back to the 2 year fixed rates, again reflecting market shifts.
House price data:
Median house prices are as reported by the Real Estate Institute of New Zealand. Although the REINZ series is more volatile than the QV equivalent, there is a highly positive correlation between the two series. The REINZ series is more current and offers an earlier indication of market trends.
In September 2013, REINZ advised that there were calculation errors in some first-quartile house prices supplied over the past twelve to eighteen months. We are now using the updated and corrected data. Earlier published results may not be accurate on this aspect
Saving Rates:
Average savings interest rates are sourced from www.interest.co.nz. These averages are for banks only, and use the 90 day term deposit rate. Saving calculations take into account the individuals marginal tax rates as defined by IRD.
Household affordability:
Household affordability is calculated in the same way as individual affordability except instead of individual income, a household income is used. The household income for a first-home buyer household is made from 1 full time male median income, and 1 full time female median income (from LEEDS data) both in the 25-29 age range. Our first-home buyer household profile does not have any children.
Disclaimer
IMPORTANT – PLEASE READ
No reader should rely on the contents of this report for making a specific investment or purchase decision. The information in this report is supplied strictly on the basis that only overall market trends are being reported on, and that all data, conclusions and opinions expressed are provisional and subject to revision.
If you are making a specific investment or purchase decision, you are strongly advised to seek independent advice from a qualified professional you trust.
The conditions and disclaimers set out in our https://www.interest.co.nz/terms-conditions are applicable to this report as well.
This report is made available on these terms only, and JDJL Limited or www.interest.co.nz or Roost is not responsible for any actions taken on the basis of information in this report, or for any error in or omission from this report.
Contact
For more information, contact
|
David Chaston |
Phone: (09) 360-9670 |

