
By Mike Blackburn*
Statistics NZ have just released their (provisional) regional population estimates for 2022.
Although these are provisional numbers (there is some pretty robust analysis behind these numbers, but at the end of the day they are simply their best estimates until the next Census) but they provide a great insight to the expected growth or decline in the population of districts and cities across the country.

The first place to look is the right hand column…did the population of the City / District go up or down?
According to StatsNZ, the population of Christchurch decreased by an estimated 700 people to the year ending 30 June 2022. This is approximately -0.2% of the Christchurch population.
Selwyn’s population increased by an estimated 3,600 people, which is approximately 5% growth.
Waimakariri’s population increased by an estimated 1.400 people, which is approximately 2% growth.
The table below shows the 2021 figures.

In the year ending 30 June 2021, the population of Christchurch decreased by an estimated 1,600 people. This is approximately -0.5% of the Christchurch population.
Selwyn’s population increased by an estimated 5,400 people, which is approximately 8% growth.
Waimakariri’s population increased by an estimated 1,800 people, which is approximately 3% growth.
How are population estimates made up?
StatsNZ look at three primary measures to assess the change in population numbers.
- Natural Increase (more births than deaths)
- International Migration (those arriving into NZ, less those leaving, for 12 months or more)
- Internal Migration (moving from one part of NZ to another)
Natural increase
This measures the number of births against the number of deaths.
In 2022, across all of New Zealand, there were 24,000 more births than deaths, this is around 4.7% growth in the population.
This is expected to remain a positive number (more births than deaths) for about the next 30 years…when (as a result of an aging population) the number of annual deaths will exceed births.
Internal migration
This is the measure of how many people are relocating into an area (Region or Territorial Authority within New Zealand) compared to the number of people leaving.
Outside of Census, this is a much harder number to track and measure.
Statistics New Zealand have a number of tools available, including school registrations, health records, vehicle registrations etc. However, as I have indicated above, this is only an accurate estimate. It’s the best data currently available and good enough to be relied upon.

The most recent data suggests that Christchurch lost 2,700 people (negative net internal migration), while Selwyn attracted 4,700 people and Waimakariri 1,600 people. It’s not hard to imagine that quite a few of those 2,700 people who left Christchurch in 2022, moved to Rolleston, Lincoln or Rangiora.
Net international migration
This is the measure of the number of people arriving into NZ, less those leaving, for a period of 12 months or more.
During the COVID lockdown (2020~2021), the media reported about the hundreds of thousands of New Zealanders who were desperately trying to get back into the Country and how many tens of thousands of people were going through MIQ.
The truth is that the vast majority of those people were only coming back to NZ for just a few months, and then leaving again. Very few were returning to NZ to relocate, resettle, and buy or rent a house.
This effectively dropped net international migration to pretty much zero in the space of around six months.

Since March 2021, there has been negative net international migration into NZ with the current estimated annual number of departures (over arrivals) at more than 15,000.
Compare this to March 2020, there was a net increase of more than 90,000 arrivals. It’s not hard to see how this has an impact on the number of houses required.
There are two direct effects of negative migration on the construction sector.
Firstly, over the past couple of years (actually since 2011) the New Zealand construction industry has been increasing its production of new housing with the expectation of meeting the need for increased demand for new housing, based on generations of underbuilding and historically high levels of international migration.
COVID lockdowns (starting March 2020) effectively turned off the tap to tens of thousands of new migrants each year, this should have been a signal to the construction sector to look to match new levels construction accordingly.
However, annual building consent numbers have continued to increase (to an absolute all-time annual record of in-excess of 50,000 dwellings in 2022), despite the obvious looming slowdown in demand.
Secondly, is that the people who are leaving the country are some of the most important people the economy and industry needs right now: Builders, tradies, doctors, nurses, teachers etc. At a time when the country has record high numbers of building consents issued, most businesses need more staff.
If you can’t get more staff…you can’t build more houses…and if you are losing the staff you already have (to Australia) it makes things tougher again. This will have a specific impact on the construction sector and related industries, not to mention the country as a whole.

Total population
Despite a small decline in the Christchurch population over the past couple of years, the City remains as the second largest in New Zealand and the centrepost of the Canterbury Region.
Growth in Selwyn and Waimakariri is not unexpected, as this continues on from the 36% and 19% population increases (respectively) as at the 2018 Census (compared to the 2013 Census). The Christchurch population increased by 8% for the same period.

Sometimes, it’s hard to find the right graph to show numbers, especially when comparing the vast difference in population between Christchurch, Selwyn and Waimakariri.
I have taken the data from the table above and put it into two different graphs.
The graph on the top shows the relative size of the populations between the districts. Christchurch has a population nearing 400,000, whilst Selwyn is around 80,000 and Waimakariri 70,000.
The Christchurch population is more than double the size of both Selwyn and Waimakariri combined.
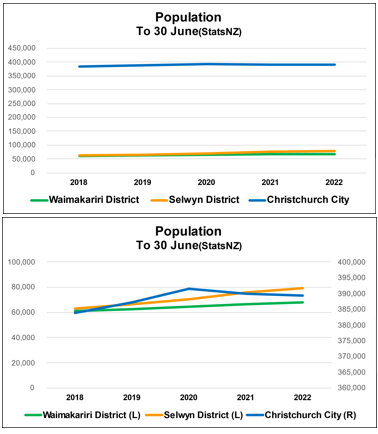
However, if you look at the graph below that, it shows the relative growth rates across the three areas, it is easy to see that Selwyn is growing faster than Waimakariri, but both districts are growing at the expense of people moving to Christchurch.
Population growth vs new building consents
The residential construction industry is known for its boom then bust cycles.
Because of the largely individual and fragmented nature of businesses in building and development, the sector is vulnerable to economic and social changes.
In less than 15 years, residential construction in Canterbury has seen no less than five significant events that have influenced the local construction market:
- 2007 Global Financial Crisis (3,800 dwellings consented across Christchurch, Selwyn, Waimakariri)
- 2011 Christchurch earthquakes (2,000 dwellings consented)
- 2014 Peak of the earthquake rebuild (6,600 dwellings consented)
- 2018 Bottom of the following downturn (3,800 dwellings consented)
- 2022 On target for 7,000 new dwellings consented across all three Councils.
This does not take into account the current tightening NZ economy, with increasing intreats rates, record high inflation and record demand for labour.
All of the above events significantly alter the number of new dwellings being built in the region (eventually).
Of course, the construction sector has been likened to “turning an oil tanker”…it takes a long time for anything to happen.
Or, more specifically, it takes the industry a long time to react to changes in the market, because most builders either don’t see these changes happening or they think that they won’t impact to them (reference: Canterbury Construction Survey 2022, by Blackburn Management).
The current market is a good example of this.
The graphs below show the population growth across each Council, compared to the number of new residential dwellings consented over the same period.
In addition, I have also included the calculation to show the Household Occupancy (measured as Persons Per Household), which is done by dividing the number of dwellings consented by the population change.
We know from the 2018 Census that the Household Occupancy for the following Councils was:
- Christchurch 2.65 pph
- Selwyn 2.92 pph
- Waimakariri 2.69 pph

In 2019 and 2020, the number of new dwellings being consented was roughly in line with population growth.
This means that the industry was building new housing at relatively the same rate as new people moving into the area.
The pph for Christchurch (at 1.6 and 1.8 respectively) reflects the increase in one and two bedroom units that started to be built from this time. Although this is noticeably lower than the 2.7 pph at 2018 Census, these numbers make sense as that particular market segment was growing.
Perhaps an early warning signal of a potential overbuild in this particular market segment.
Fast forward to 2021 and 2022 and the population growth has changed significantly.
The overall number of new residents in Selwyn and Waimakariri continue to increase, while there is a fall in the number of people in Christchurch for the first time since the earthquakes in 2010 and 2011. Not a lot…but definitely negative growth. And this decline continues across to 2022.
But, what is most surprising is that the number of new dwellings being consented in Christchurch continues to grow. Almost 4,300 new dwellings in the year to 30 June 2022 (a 46% increase over the number of dwellings consented for the same period in 2021 across the city).

If you look at the household occupancy numbers, again, Selwyn and Waimakariri are reasonably close to their 2018 Census levels, however as these numbers get smaller it suggests that we are building more houses than the comparative increase in population.
This is most obvious when you look at the Christchurch numbers. The moment the pph number drops below 2.0 you have a problem.
Remember, persons per household, is the population divided by the number of occupied dwellings. This gives the average number of occupants, per dwelling (household).
If this number falls significantly below the current average, it indicates that we are simply building more houses than needed.
Worse than this, it is also an indication that (specifically in the case of Christchurch) there are more smaller one and two bedroom units being built…which will not suit the greater part of the population who need a three bedroom house or larger.
Because the current (2018 Census) average household occupancy across all three Councils is close enough to 2.7 pph, anything close to or below 2.0 should be a concern, but for Christchurch to have a negative number (for two years in a row) is a significant red flag.
Mike Blackburn is the principal of Blackburn Management. You can contact him here.
We welcome your comments below. If you are not already registered, please register to comment
Remember we welcome robust, respectful and insightful debate. We don't welcome abusive or defamatory comments and will de-register those repeatedly making such comments. Our current comment policy is here.