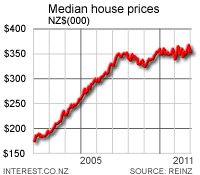
 House sales volumes were steady in May from April, while the median sale price dropped slightly from NZ$340,000 to NZ$337,500, the Real Estate Institute of New Zealand (REINZ) reported. (Update 2 includes proportion of houses sold in various price ranges.) The REINZ reported 6,291 sales in May, up very slightly from the 6,210 in April, but up 44% from May 2008. However, the May 2009 sales numbers were lower than May months from 2007 back to 2001, which averaged 9,202 per month. There were 5,395 sales in May 2000. The fall in the median price was the first fall of the year, with prices having risen from a low of NZ$325,000 in January. The median price in May was down 4.1% from the peak of 352,000 in November 2007. The REINZ's days to sell in May was 42, the same as in April and down from 49 in May 2008. However it still remained higher than any May months back to 2001 (when it was 55). REINZ President Mike Elford that the steady sales volumes and days to sell figures were signs that pointed to market stability. "The REINZ May sales figures released today show people are prepared to pay market rates for properties, and the rise in the number of properties in the upper end of the market indicates a level of confidence," Elford said. He said the biggest issue currently facing the industry was a shortage of stock.
"With an apparent reluctance to sell in what is perceived to be a buyers' market, people are tending to hunker down and sit tight on their properties. This, combined with a seasonal trend for people to hibernate rather than put their home on the market in the winter months, has led to an acute shortage of houses on the market," he said. Main centres In Auckland, sales volumes rose 1.6% to 2,114 from April. This compared to 1,388 sales in May 2008 but was still below other May months back to 2002. The median sale price rose from NZ$435,000 to NZ$450,000 over the month (the same as in May 2007). In May 2008 the median price was NZ$447,500. In Wellington, sales volumes fell by 2.6% over the month to 673, but were still up from the 534 sales in May 2008. The median price rose to NZ$380,000 from NZ$367,500 in April, but was still down from NZ$389,500 in May 2008 and NZ$385,000 in May 2007. Sales in Canterbury/Westland fell by 1% to 955 from April. They remained up from 619 in May 2008 but below the average May sales of 1,350 between 2002 and 2007. The median sale price fell 3.4% from April to NZ$285,000 and was down from NZ$296,000 in May 2008. Price ranges: Proportions of houses in each range While total sales increased by 81 between April and May, the amount of houses sold for over NZ$1 million rose by 29, or one-fifth, to 180. These sales made up 2.8% of all sales in May, up from 2.4% in April but down from 3.3% in May 2008. The proportion of houses sold between NZ$600,000 and NZ$999,000 was 10.4% in May, from 10.2% in April and 11.6% in May 2008. Houses sold between NZ$400,000 and NZ$599,999 made up 23.5% of total houses sold in May. This was down from 24.1% in April and 23.8% in May 2008. The proportion of houses sold for under $400,000 was 63.2% in May, from 63.3% in April and 61.3% in May 2008.

We welcome your comments below. If you are not already registered, please register to comment
Remember we welcome robust, respectful and insightful debate. We don't welcome abusive or defamatory comments and will de-register those repeatedly making such comments. Our current comment policy is here.