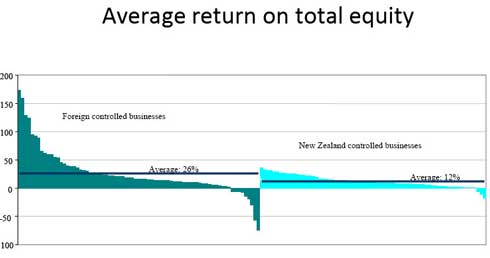
Summer chart series: How foreign owned NZ businesses perform much better than our own
4th Jan 10, 9:01am
by
Bernard Hickey picks out 10 charts from 2009 in a series of videos to play over the Summer break. In this video he looks at how foreign owned businesses in New Zealand produce an average 26% return on equity, while New Zealand owned businesses produce an average 12% return on equity. The chart produced by IRD for the Tax Working Group shows the spread of returns on equity. It raises questions about why foreign owned businesses are so much more profitable and whether they pay a fair share of corporate taxes. 

We welcome your comments below. If you are not already registered, please register to comment
Remember we welcome robust, respectful and insightful debate. We don't welcome abusive or defamatory comments and will de-register those repeatedly making such comments. Our current comment policy is here.