Summer chart series: How the rich stopped declaring their incomes
6th Jan 10, 9:01am
by
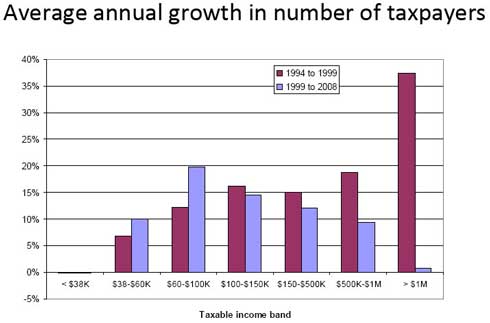
Bernard Hickey picks out 10 charts from 2009 in a series of videos to play over the Summer break. In this video he looks at how top taxpayers mysteriously stopped growing their incomes after a new top tax rate was introduced. The chart below shows that growth of high net worth individuals (or at least the income they declared to the IRD) plummeted in the years after 2000 compared with the previous 10 years. This chart was produced as part of the Tax Working Group process. The IRD suggested many high net worth individuals were structuring their tax affairs to avoid including income in the top tax band, including the use of family trusts and LAQCs to shelter income or produce losses to reduce taxable income. 

We welcome your comments below. If you are not already registered, please register to comment
Remember we welcome robust, respectful and insightful debate. We don't welcome abusive or defamatory comments and will de-register those repeatedly making such comments. Our current comment policy is here.