

This article updates our understanding of the global capital markets. It's based on a very comprehensive stocktake by SIFMA, the Securities Industry and Financial Markets Association from the US. The original document is here.
As they say, capital is critical to companies for running day-to-day business operations or for various business purposes. For instance, early stage companies need additional capital to grow to the next stage in the business life cycle. Or companies may need capital to expand organically or via acquisition, whether it be for product or regional diversification.
Individuals or companies – whether at the startup level or an established firm – need capital to turn ideas into usable innovations and often new, sustainable enterprises. Governments need capital to operate their country, state, or city, as well as invest in infrastructure projects such as bridges, roadways, or schools. Therefore, capital is an integral component supporting job creation, economic development, and prosperity, and plays a crucial role in any country’s economy.
Capital markets facilitate the transfer of capital from those seeking a return (investors) to those who need capital to grow their enterprises (issuers). Capital markets, put simply, are the way we connect providers of capital with users of capital. These relationships are facilitated by financial institution intermediaries, which play a critical role in making capital markets work. Efficient capital markets allow capital users to receive lower cost funding over time while allowing investors to identify appropriate opportunities to deploy their capital.
These days, pension funds and sovereign wealth funds are major components of the investor base.
Capital markets fuel economies
Firms have several ways they can acquire capital. Outside of generating cash from operations, firms can go to either the capital markets or loan markets. With capital markets, debt issuance is a more efficient and less restrictive form of borrowing for corporations than typical loan transactions. Capital markets typically function as shock absorbers during times of economic or market stress – whereas bank lending can dry up under strain – making capital markets a more stable source of funding. On the equities side, a commonly used capital markets vehicle is an initial public offering (IPO), during which a private company raises capital by offering its common stock (equity) to the public for the first time.
Equities
Listed equities have a global market capitalisation of US$115 trillion (~NZ$200 tln or 1200x more than the NZX). The S&P500 is US$42 tln of that, a bit more than a third (36%) of the global equity markets.
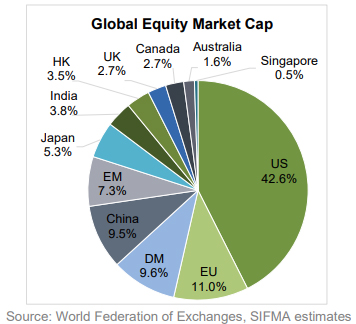
This rose +13% in 2023 from 2022, a rise of +US$13.6 tln (+NZ$23 tln). That is a +74% rise in the past 10 years.
These markets may be rising, but the rise isn't even. Here are how some major markets fared in that decade.
| 2013 | 2023 | change | |
| US$ tln | US$ tln | ||
| USA | 24.035 | 48.980 | +104% |
| EU | 8.612 | 12.622 | +47% |
| Japan | 4.543 | 6.149 | +35% |
| China | 3.949 | 10.936 | +177% |
| India | 2.251 | 4.340 | +93% |
| Australia | 1.366 | 1.789 | +31% |
| Everywhere else | 21.454 | 30.209 | +41% |
While equity capitalisation rose fastest in China, that rise was 'only' +US$7 tln and far smaller than the +US$25 tln rise in the same period in US markets.
Of course, secondary market activity doesn't actually raise capital for companies. It only provides price discovery for them when they issue. Actual equity issuance was quite light in 2023, totalling US$422 bln.
| 2013 | 2023 | change | |
| US$ bln | US$ bln | ||
| USA | 254.8 | 127.3 | -50% |
| EU | 93.2 | 43.5 | -53% |
| Japan | 42.8 | 30.1 | -30% |
| China | 29.7 | 93.1 | +213% |
| Australia | 21.3 | 10.8 | -51% |
| Everywhere else | 210.6 | 117.4 | -44% |
Debt / Fixed Income
Fixed income is also a global market and worth more than US$140 tln in securities outstanding. So larger than the equity markets.
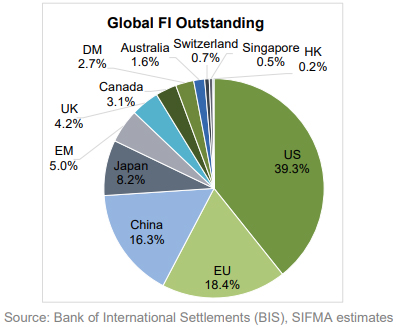
This rose +5.9% in 2023 from 2022, a rise of +US$7.8 tln (+NZ$13 tln). That is a +65% rise over the past 10 years.
These markets are also rising, but the rise isn't even here either. Here are how the same major markets fared in that decade.
| 2013 | 2023 | change | |
| US$ tln | US$ tln | ||
| USA | 32.730 | 55.299 | +69% |
| EU | 22.663 | 25.830 | +14% |
| Japan | 11.900 | 11.496 | -3% |
| China | 4,961 | 22.914 | +362% |
| Australia | 1.980 | 2.259 | +14% |
| Everywhere else | 10.991 | 22.877 | +108% |
The rise in fixed income securities outstanding was +US$18 tln in China, and +$23 tln in the US.
New issuance in 2023 was +US$2.9 tln. That was down from US$3.1 tln in 2013, -6.4%
Equities and fixed income aren't the only two financial sectors covered by SIFMA.
The global derivatives market
In 2023 the global derivatives market had US$754 tln outstanding, which interestingly represented a -1.7% fall from 2013.
At US$754 tln, these derivatives markets are almost three times as large as the combined equity and fixed income/debt markets. But as large as they are, they stopped growing after the Global Financial Crisis, but have sprung back into growth more in the past two years putting on +8% growth in 2023 from 2022. +8% is an expansion of a mammoth +US$55 tln in one year. That one year growth in derivatives is more than half the total capitalisation of equity markets in 2023.
The exchange-traded corner of this market rose +51% in that decade to US$87 tln. It was the over-the-counter market in derivatives that fell, down -6.1% in those ten years.
The full report is here.
These are the gigantic financial forces that wash over New Zealand and the countries we trade with. And they are represented by the unlimited 0s and 1s in the world's data centers. And of course those data centers are handling very much more that just financial transactions and recording financial balances. But that is another story of enormity entirely.
The Bank for International Settlements releases details of banking system cross-border flows. They are here. They are only loosely related to the SIFMA data.
6 Comments
And there we have it. Buried on Page 94.
USA - Total Debt as a % of GDP 2009 = 82%, of which 52% was held by The Public.
2023 = 122%, of which 97% was held by The Public.
And today? 2024 = 125%. But what was it 50 years ago, 1974? 32%
What could possibly go wrong?
Hi bw. Please can you enlighten us non-economists here?
David Chaston is sounding a warning, to those with the right kind of ears.
There are more betting-slips on the future (that's all you can bet on, after all - and it's future energy and resources need, or your bets are unassuageable) than there is planet remaining. The Great Acceleration - from WW2 until say 1970 - had enough planet to underwrite the dollars issued. Then it couldn't - which is why Nixon had to drop the gold-index (drop even the last pretense of relativity to something tangible).
Since then, we've drifted further and further into debt, and raised the 'values' of existing items (from houses to GTHO Falcons - it doesn't matter what it is if it can sponge up some of the issued digits.
All the while we were depleting the planet, best-first, and exponentially quicker. So the underwrite went exponentially down, as the dollar-issuance has gone exponentially up. That had to be reconciled - and the longer it was prolonged, the bigger the required reconciliation. They'd have been better letting it fall over and recalibrate, in 2007/8. This one, they won't be able to hold; the level of inflation required to match current claims on the future, with the remaining planet, is eye-watering. And it's their only 'tool'.
They'd have been better letting it fall over and recalibrate, in 2007/8.
So spot on. I do wonder in 50 years time how history will look back on that one. The rich got mega richer as thousands upon thousands of Americans lost their homes. An asset grab of such immense proportion - fostering more and more and more asset grabs from the 'commoners/labouring class that sells their labour for a wage (which gets eaten by inflation and taxation).
Marx foresaw it but never really convinced me of what would replace it. He was a utopian but I don't see it. Instead we invent new ways of manipulating markets and selling thin air..
Marx foresaw it and believed the people would replace it based on his information. Unfortunately the people didn't have the right leaders. Maybe capitalism needs to eat itself first... but the shock may be too great.
Buddha taught it, Jesus taught it (and he learned it from the Egyptians, the yogis and Buddha). The Dao teaches it, as did Indigenous wisdom.
Humanity has been consumed by business, economics and finance.
Just to clarify for others, those numbers are for the US Federal government only.
US total private credit to GDP is found here:
https://data.worldbank.org/indicator/FS.AST.PRVT.GDZS?locations=US
So in the US:
1) Total private credit to GDP is 194.4%
2) US Federal government debt to GDP is 122%.
We welcome your comments below. If you are not already registered, please register to comment
Remember we welcome robust, respectful and insightful debate. We don't welcome abusive or defamatory comments and will de-register those repeatedly making such comments. Our current comment policy is here.